• Home
  • Forums
  • Trades
  • News
  • Calendar
  • Market
  • Brokers
  • Login
  • Join
  • User/Email: Password:
  • 5:32am
Menu
  • Forums
  • Trades
  • News
  • Calendar
  • Market
  • Brokers
  • Login
  • Join
  • 5:32am
Sister Sites
  • Metals Mine
  • Energy EXCH
  • Crypto Craft

Options

Bookmark Thread

First Page First Unread Last Page Last Post

Print Thread

Similar Threads

Trading with "Point And Figure" 35 replies

Trading with Point and Figure 131 replies

Point and Figure Trading 31 replies

Point and Figure Trading 16 replies

Pros and Cons of Point & Figure Trading 10 replies

  • Trading Discussion
  • /
  • Reply to Thread
  • Subscribe
  • 164
Attachments: Intraday Point and Figure Trading
Exit Attachments
Tags: Intraday Point and Figure Trading
Cancel

Intraday Point and Figure Trading

  • Last Post
  •  
  • 1 1516Page 171819 28
  • 1 16Page 1718 28
  •  
  • Post #321
  • Quote
  • Aug 22, 2011 5:50am Aug 22, 2011 5:50am
  •  fteller
  • | Commercial Member | Joined Dec 2010 | 182 Posts
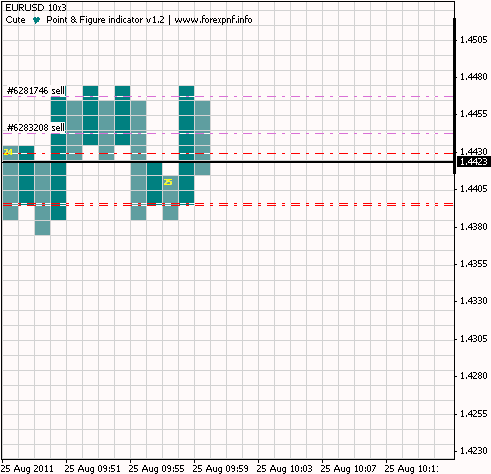
*EUR attempted a rally last week but found resistance at 1.4516 and pulled back.
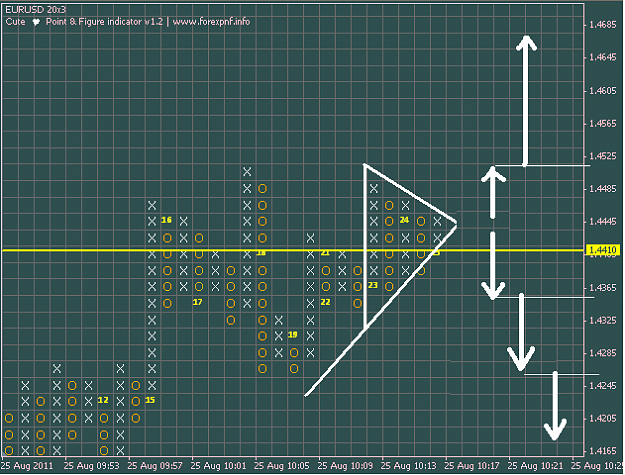
*As we have noted before, the key resistance level on the daily chart is 1.4530/40 and only a firm move abv there will indicate the next leg higher is under way.
*Until that happens, EUR/USD is in trading range.
Trade Idea: EUR/USD - Buy Stop at 1.4420; Target: 1.4900 ; Stop: 1.4310.
http://img822.imageshack.us/img822/8294/m11aug22.png
Inserted Code
https://docs.google.com/spreadsheet/pub?hl=ru&hl=ru&key=0AhXFe9FXJohUdFE0b0FKY3d6eEVCZm04WjlxU0UtTlE&single=true&gid=1&output=html
https://docs.google.com/document/pub?id=1802O1jqxFocie_a6-SU_qe2G75KoKC_JO_InzIxqx1k#id.mprxaw5178k8
 
 
  • Post #322
  • Quote
  • Edited 12:36pm Aug 23, 2011 11:00am | Edited 12:36pm
  •  ChartistLion
  • | Joined May 2011 | Status: Member | 10 Posts
Quoting KMidas
Disliked
No I have not used it before. I just read the book of DuPlesis and I saw the webinar that he did. It is really very impressive tool for Point and Figure. But I don't know if £499 per year worth it for my small start up account. I suppose it is just a charting software right? The data must be obtained elsewhere.

Can you tell more details about your configuration? I would like to know more about the total cost per month and where you get the data from. Also I suppose you do your analysis with it and use your brokers platform to enter the orders....
Ignored
TraderPro is primarily a charting package. It's very hard to find a robust charting package which also allows execution. So I guess when it comes to trading you have to see what you value most. That price tag is, for what it is, a bargain.

The International version doesn't come with a feed but Updata do have their own feeds which you could get as an extra. So I guess you'd probably want to get their FX feed (covers over 2000 currency pairs!! not sure if I ever look at that many though! )

I guess the best would be to try the software. There's an option to trial it for free for a couple of weeks on the site: http://www.updata.co.uk/PI/Try-or-Buy.aspx


Chartist Lion
 
 
  • Post #323
  • Quote
  • Aug 25, 2011 5:17am Aug 25, 2011 5:17am
  •  puma1
  • | Commercial Member | Joined May 2010 | 282 Posts
Setup: 10x3

Attached Image
 
 
  • Post #324
  • Quote
  • Aug 25, 2011 5:56am Aug 25, 2011 5:56am
  •  puma1
  • | Commercial Member | Joined May 2010 | 282 Posts
EUR/USD prediction for close future.
Setup: 20x3

Strong Triangle
is formed and it will become Bullish Triangle or Bearish Triangle, waiting for breakout.
Two scenarios here:

Attached Image (click to enlarge)
Click to Enlarge

Name: pnf_prediction-2011-08-25.PNG
Size: 19 KB
 
 
  • Post #325
  • Quote
  • Aug 26, 2011 6:05am Aug 26, 2011 6:05am
  •  manojcosmo
  • | Joined Sep 2010 | Status: Member | 31 Posts
Quoting puma1
Disliked
EUR/USD prediction for close future.
Setup: 20x3

Strong Triangle
is formed and it will become Bullish Triangle or Bearish Triangle, waiting for breakout.
Two scenarios here:

Attachment 771258
Ignored
As you have shown in the chart the breakout level but when the price is moving where to we enter a trade wait for the breakout of 10 pips one box then enter buy or sell or put a limit order a pip above the breakout and what would be the take profit ?

Thanks In advance
 
 
  • Post #326
  • Quote
  • Aug 30, 2011 3:33am Aug 30, 2011 3:33am
  •  fteller
  • | Commercial Member | Joined Dec 2010 | 182 Posts
GBP/USDound trading flat this morning
For the 24 hours to 23:00 GMT, GBP rose 0.37% against the USD and closed at 1.6409.
The pair opened the Asian session at 1.6409, and is trading at 1.6408 at 3.00GMT. GBP is trading flat versus USD from yesterday’s close at 23:00 GMT.
http://img200.imageshack.us/img200/852/m11aug30.png
~~~>mdunleavy.byethost7.com/11Aug29.html
Inserted Code
https://docs.google.com/document/pub?id=1802O1jqxFocie_a6-SU_qe2G75KoKC_JO_InzIxqx1k#id.wnlh7655fung
 
 
  • Post #327
  • Quote
  • Aug 30, 2011 5:37am Aug 30, 2011 5:37am
  •  puma1
  • | Commercial Member | Joined May 2010 | 282 Posts
Point and Figure
setup: 10x3
figure: triangle breakdown

Attached Image
 
 
  • Post #328
  • Quote
  • Sep 1, 2011 10:46am Sep 1, 2011 10:46am
  •  ChartistLion
  • | Joined May 2011 | Status: Member | 10 Posts
Certainly interesting puma1. Hope you'd also gotten the target of 1.426 for EURUSD which was actually surpassed
Attached Image
 
 
  • Post #329
  • Quote
  • Sep 12, 2011 3:10am Sep 12, 2011 3:10am
  •  fteller
  • | Commercial Member | Joined Dec 2010 | 182 Posts
*The GBP/USD may continue its drop if data from the U.K. or other global economies remained bearish as it will increase the appeal of the dollar as a safe haven. On the hand, the dollar may remain boosted by the $447 billion jobs stimulus plan proposed by president Obama the pervious week.
*This week, the main attention will be on inflation data from both economies as it will give an update about inflation status amid expectations that there might be monetary intervention by the Fed on Sep. 20-21 meeting and by the BoE later in the year.
http://img88.imageshack.us/img88/9281/m11sep11.png
CLICK HERE for detail information...
~~~>mdunleavy.byethost7.com/11Aug29.html
~~~>img263.imageshack.us/img263/640/11sep111.pdf
 
 
  • Post #330
  • Quote
  • Sep 14, 2011 3:05am Sep 14, 2011 3:05am
  •  fteller
  • | Commercial Member | Joined Dec 2010 | 182 Posts
GBPUSD
==========
The GBPUSD continued its bearish momentum yesterday and hit 1.5752 earlier today in Asian session.
http://img18.imageshack.us/img18/1416/11sep13.gif
Other charts:
Inserted Code
https://docs.google.com/document/pub?id=1802O1jqxFocie_a6-SU_qe2G75KoKC_JO_InzIxqx1k
 
 
  • Post #331
  • Quote
  • Sep 16, 2011 2:36am Sep 16, 2011 2:36am
  •  fteller
  • | Commercial Member | Joined Dec 2010 | 182 Posts
Exotic pair GBPSGD (British Pound SterlingSingapore Dollar).
~~~>img641.imageshack.us/img641/2006/11sep16.pdf
Attached Image (click to enlarge)
Click to Enlarge

Name: 240t11Sep16.PNG
Size: 121 KB
 
 
  • Post #332
  • Quote
  • Sep 27, 2011 2:51am Sep 27, 2011 2:51am
  •  fteller
  • | Commercial Member | Joined Dec 2010 | 182 Posts
Market Commentary Dollar Index is just nearing resistance zone of 78.75-79.30 ranges though double dip depression in the US is still glooming resulting in most of the asset classes trading softer especially the equities, the dollar index may go sideways.
~~~>img842.imageshack.us/img842/5364/11sep27.pdf
http://img163.imageshack.us/img163/4300/11sep272.png
 
 
  • Post #333
  • Quote
  • Oct 2, 2011 7:33am Oct 2, 2011 7:33am
  •  bredin
  • | Joined Aug 2010 | Status: Insanity Trader | 23 Posts
P&F is really interesting

Normally I use it to show S/R and stuff like that to trade from extremes.. but i noticed a nice repeating pattern away from the extremes that may be worth scalping...

anyways, its just something Ive been playing with on the weekend, need to watch this live to see the actual behaviour..

and, yes that is a Point and Figure chart on MT4, with other indicators loaded onto it.
Attached Image (click to enlarge)
Click to Enlarge

Name: pandf16.jpg
Size: 145 KB
 
 
  • Post #334
  • Quote
  • Oct 2, 2011 9:05am Oct 2, 2011 9:05am
  •  bredin
  • | Joined Aug 2010 | Status: Insanity Trader | 23 Posts
seeing what I can see with...

moving averages
stochastics
moneyflow index
parabolic sar
3lzigzag...

mabee nothing, but you never know until you take a look at it.

G.
Attached Image(s) (click to enlarge)
Click to Enlarge

Name: pandf17ma.gif
Size: 31 KB
Click to Enlarge

Name: pandf18stoch.gif
Size: 31 KB
Click to Enlarge

Name: pandf19mfi.gif
Size: 26 KB
Click to Enlarge

Name: pandf20psar.gif
Size: 29 KB
Click to Enlarge

Name: pandf213lzz.gif
Size: 33 KB
 
 
  • Post #335
  • Quote
  • Oct 2, 2011 11:46am Oct 2, 2011 11:46am
  •  RaverStyleTim2
  • | Joined Mar 2007 | Status: Member | 418 Posts
anyone ever get a point and figure with volume going? verticle volume
 
 
  • Post #336
  • Quote
  • Oct 2, 2011 5:37pm Oct 2, 2011 5:37pm
  •  bredin
  • | Joined Aug 2010 | Status: Insanity Trader | 23 Posts
Why, yes.

someone has included volume in their P&F chart.

in fact you could use any volume indicator you wanted to.

G.
Attached Image (click to enlarge)
Click to Enlarge

Name: pandf22volume.gif
Size: 33 KB
 
 
  • Post #337
  • Quote
  • Oct 2, 2011 5:47pm Oct 2, 2011 5:47pm
  •  RaverStyleTim2
  • | Joined Mar 2007 | Status: Member | 418 Posts
i think thats a damn first. i went to your website and was confused on how to get ahold of that indicator. i saw something about a donation but i was just lost.
 
 
  • Post #338
  • Quote
  • Oct 3, 2011 1:06am Oct 3, 2011 1:06am
  •  bredin
  • | Joined Aug 2010 | Status: Insanity Trader | 23 Posts
Its a two step process

1. Register at the forum (registration links in the header) and log in
2. use the donate link on the left navbar.

all things going well you should have access to the donational indicators.
You will need to be logged in to download.

any issues PM me here or at Insanity Industries.

G.
 
 
  • Post #339
  • Quote
  • Oct 3, 2011 6:07am Oct 3, 2011 6:07am
  •  toddanderson
  • | Joined Jul 2005 | Status: Member | 515 Posts
Looking at some of the images you posted,
I am interested in the 0000 indicator your using, wide one blue, Is that on your web site, as i was searing for it and did not find it.


Quoting bredin
Disliked
Its a two step process

1. Register at the forum (registration links in the header) and log in
2. use the donate link on the left navbar.

all things going well you should have access to the donational indicators.
You will need to be logged in to download.

any issues PM me here or at Insanity Industries.

G.
Ignored
Attached Image (click to enlarge)
Click to Enlarge

Name: 0000 indicator.gif
Size: 31 KB
 
 
  • Post #340
  • Quote
  • Oct 3, 2011 8:29am Oct 3, 2011 8:29am
  •  fteller
  • | Commercial Member | Joined Dec 2010 | 182 Posts
Quoting bredin
Disliked
Its a two step process

1. Register at the forum (registration links in the header) and log in
2. use the donate link on the left navbar.
Ignored
I tried to register, there is a problem!

The field “AOL Instant Messenger” must be completed.
The field “WL/MSN Messenger” must be completed.
The field “Yahoo Messenger” must be completed.
The field “Jabber address” must be completed.

Why? You may need a fingerprint? :-)

You can offer a demo version of the indicator?
For example you can put in our archive?
 
 
  • Trading Discussion
  • /
  • Intraday Point and Figure Trading
  • Reply to Thread
    • 1 1516Page 171819 28
    • 1 16Page 1718 28
0 traders viewing now
  • More
Top of Page
  • Facebook
  • Twitter
About FF
  • Mission
  • Products
  • User Guide
  • Media Kit
  • Blog
  • Contact
FF Products
  • Forums
  • Trades
  • Calendar
  • News
  • Market
  • Brokers
  • Trade Explorer
FF Website
  • Homepage
  • Search
  • Members
  • Report a Bug
Follow FF
  • Facebook
  • Twitter

FF Sister Sites:

  • Metals Mine
  • Energy EXCH
  • Crypto Craft

Forex Factory® is a brand of Fair Economy, Inc.

Terms of Service / ©2023