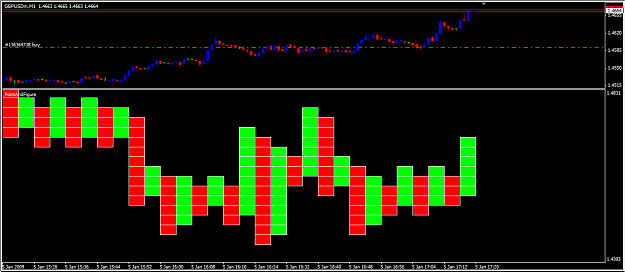
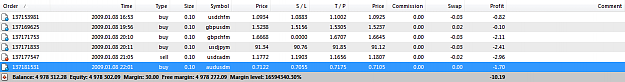
I am interested in testing the "Point And Figure" system.
If somebody else is trading this system please let us know how this is going.
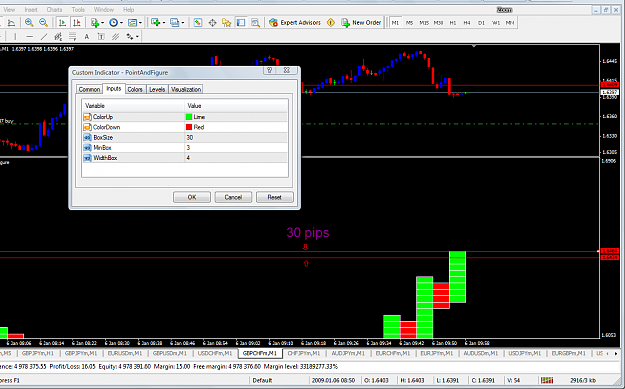
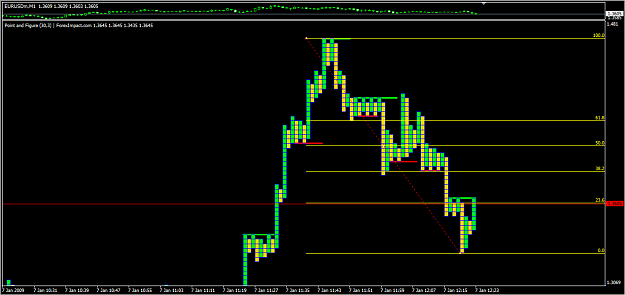
Here is the indicator used with the system:
Regarding the settings for the indicator here is a link to the creator's post:
http://www.forexfactory.com/showpost...20&postcount=1
You can find the formula (P&F.pdf) for Entry/exit in post #11 of this thread:
http://www.forexfactory.com/showthread.php?t=93932
If somebody else is trading this system please let us know how this is going.
Here is the indicator used with the system:
Attached File(s)
Regarding the settings for the indicator here is a link to the creator's post:
http://www.forexfactory.com/showpost...20&postcount=1
You can find the formula (P&F.pdf) for Entry/exit in post #11 of this thread:
http://www.forexfactory.com/showthread.php?t=93932