*Our overall outlook for crude oil prices is bearish, as the outlook for global growth is worsening due to mounting concerns from Europe and the fact that major economies around the globe are still weak, and that should put negative pressure on crude oil prices.
*Traders will be awaiting the infamous jobs report from the United States on Friday, and a strong figure could boost optimism and push crude oil prices higher. [Topcommodities Net] https://lh6.googleusercontent.com/-v...00/11Nov29.png
Learn more :
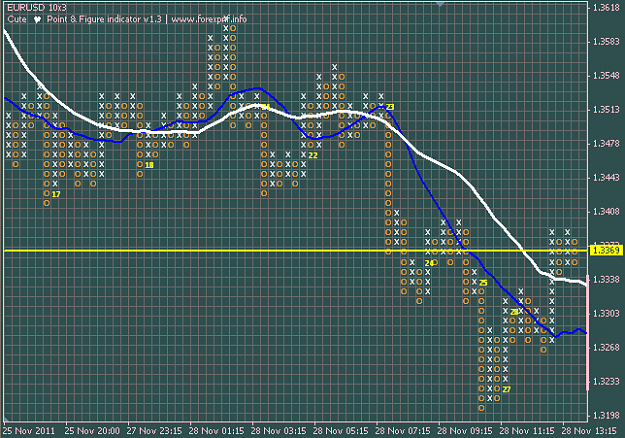
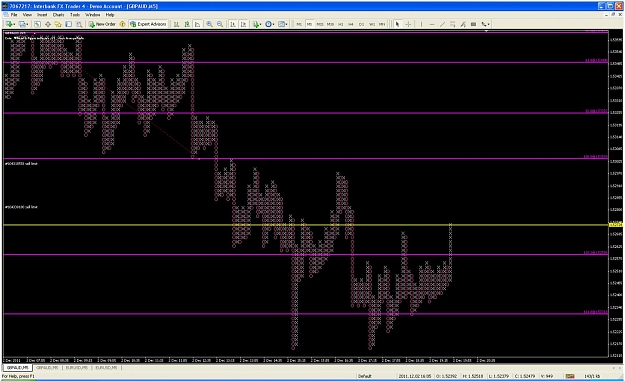
PnF charts are a GREAT way to to find Supply and Demand Zones as bredin has pointed out.
I don't really care for the breakout/breakdown trades as risk is increased and profits are minimized unless there is a retest of the breakout/breakdown area.
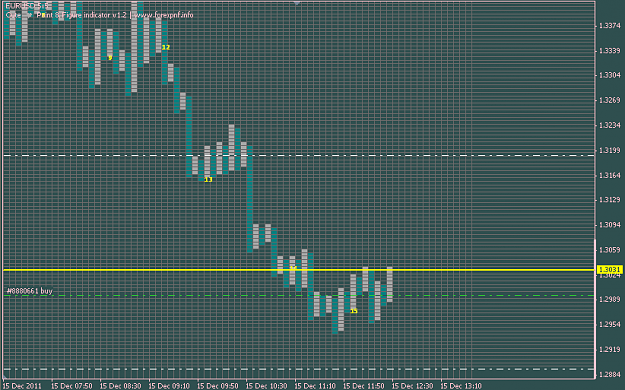
The settings I use are: Box Size 2, Reversal 5 on a 1min, 5 min or 15 min chart .
I look only to trade in previous Supply And Demand Zones.
These settings are also good for scalping 7-10 pips on 5 min or 1min charts, many time you can find good range trades to scalp on these time frames, being mindful of which Zone you are in or coming out of.
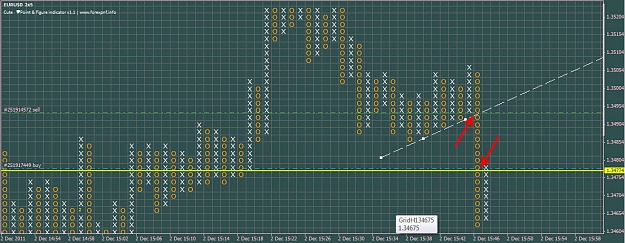
This is my first post here at Forex Factory and I'm just getting into the fascinating world of Forex trading. I have almost no experience whatsoever when it comes to Forex, but I'm eager to learn. The simplicity behind Point And Figure trading seems very appealing to me. That ofcourse might be, because I'm such a beginner.
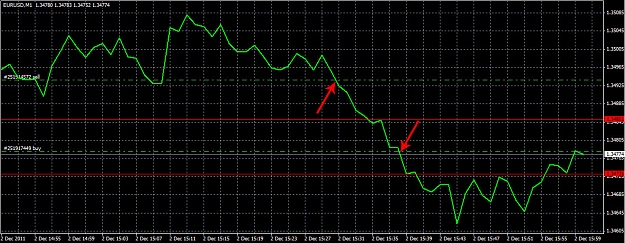
I made my first trade on my demo account today and thought about posting it here and asking for the opinion of you guys who have experience. I attached screenshots of the trade. (Ignore the 2 red horizontal lines on the second attachment.) As the trade was quite profitable relative to how quick it was, it gave me a great motivating feeling.
What do you think about the trade?
Was my interpretation of the graph correct in regards the timing of the Sell?
I was not sure when to Take the Profits so I just summed the horizontal number of the X and O columns (8) along the short trendline. What methods would be best to find out the SL and TP?
PS. I missed the Buy at 15:18, which came after all of the 3 previous X's being lower than the other, when I left the room just for a few minutes. I would have gone in the trade at a good moment, but ofcourse I would have not been sure when to Take the Profits...
CL had a positive day for the Friday session as traders continue to buy commodities in general. The market looks like it wants to attempt a breakout above the recent highs of $103 and if it does – this could be the beginning of the next massive leg up in the market. However, we expect the area to actually be more resistance than the market is ready to go up against at the moment. We are buyers, but will need to see a pullback first.
[meta4forexbroker] https://lh6.googleusercontent.com/-I...Qn4/s400/1.png
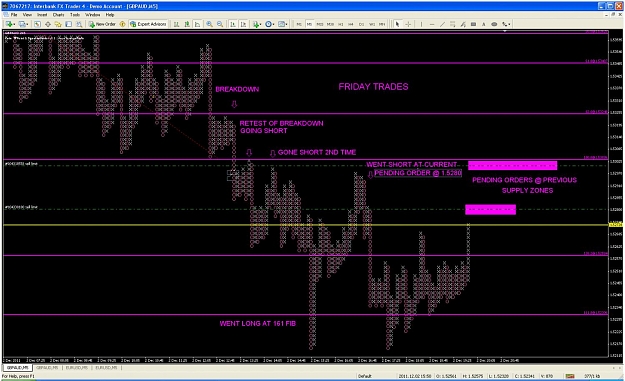
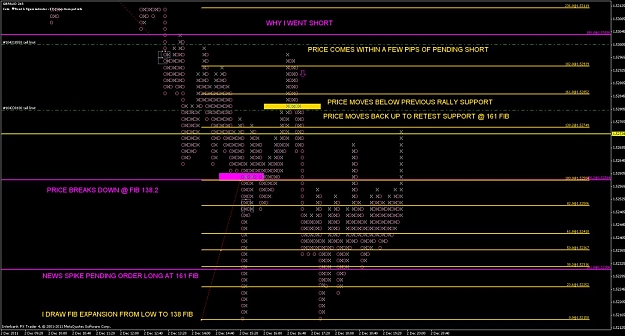
Here's a step by step of the trade I took on Friday to help trade Point and Figure with Supply and Demand Zones.
It's actually 2 trades the first is a pending order long I have had sitting there for 2 weeks that was triggered on the news event.
Here's the order:
1.Price breaks down @ 138 fib to trigger my pending order at 161 fib expansion.
2.Price rally's to 138 fib, I exit trade with nice profit.
3.When price hit's 138 fib, I draw gold fib expansion from low of news to the 138 fib (MAGENTA).
4. The closest fib is the 182 fib(GOLD) and the 100 fib(MAGENTA), I placed a pending Sell just above the 182 fib that is still there.
5. Price didn't quite make it so I waited to see If my estimate was good, price broke below the 161 fib(GOLD) and a previous rally support (GOLD RECTANGLE) I knew I missed the boat so I was looking for the next best entry.
6. I placed a pending order at the current lower pending order and waited for price to get back up there (GOLD RECTANGLE). It did and I rode the trade back down to almost the 161 fib.
Now I am waiting for price to return to those levels to get in short but I will have a stop just above the 100 fib (MAGENTA) just in case.
Apparently this thread does not interest traders anymore.
Is it because Point and Figure seems old school? Or, is it too hard to master? I don't think it is.
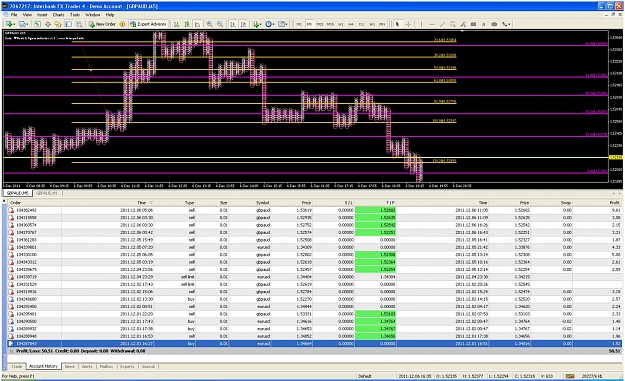
Here is my demo statement covering the last 5 days of trading using a Point and Figure Indicator on a 5 min chart. (chart time frame is not important to me).
Well if 500 pips a week with very minimal effort does not interest anyone something is wrong.
I will give you a hint: Understanding Order flow and a Point and Figure chart are all you need to become a successful trader.
I would also suggest you check out Sam Seidens free video's on fx street, they are a real eye opener!
Let's help each other become more successful, start posting some trades and help someone struggling!
Apparently this thread does not interest traders anymore.
Is it because Point and Figure seems old school? Or, is it too hard to master? I don't think it is.
Here is my demo statement covering the last 5 days of trading using a Point and Figure Indicator on a 5 min chart. (chart time frame is not important to me).
Well if 500 pips a week with very minimal effort does not interest anyone something is wrong.
I will give you a hint: Understanding Order flow and a Point and Figure chart are all you need to become a successful trader.
I would...
Ignored
Good job.
I think the reason more don't use it is a combination of both. Too old school and they don't really understand it.
I've been looking into this recently (as I've had an interest in PnF for awhile). Haven't done alot with it yet. Thinking of trading it on my other account and see how it goes. I've checked at Sam's stuff and it seems pretty straight forward.
Do you trade breakout patterns or is it mostly based on supply/demand zones?
Ignored
Thanks spzd.
Yeah, I figure it's probably both too, but I hope that traders who are using PnF would chime in and post some ways that they are trading to help others.
I trade primarily Supply and Demand Zones for the low risk and high probability of it but I do occasionally take a breakout or breakdown with a retest. I MUST have a retest or it's no trade for me.
The previous post I did with the explanation using the Fib expansion was a breakdown with a retest short trade, it worked out great!
The real excitement for me is understanding the Supply and Demand, Point and Figure just helps me visually locate the high probability Zones vs candles or even renko bars a lot easier.
If you understand the straight forward explanation Sam Seiden gave, then trading with Point and Figure will be a breeze for you.
Yeah, I figure it's probably both too, but I hope that traders who are using PnF would chime in and post some ways that they are trading to help others.
I trade primarily Supply and Demand Zones for the low risk and high probability of it but I do occasionally take a breakout or breakdown with a retest. I MUST have a retest or it's no trade for me.
The previous post I did with the explanation using the Fib expansion was a breakdown with a retest short trade, it worked out great!
The real excitement for me is understanding the...
Ignored
Thanks for the breakout explanation. I'll have to go back and read that post in depth. As far as Seidon's stuff, I have a fairly good grasp of it. I'm going to have to observe the PnF chart for a bit to get a better feel for it. I do like how it removes all the noise.
You said you use the 5 minute chart, what box size and reverse do you use, if you don't mind my asking?
Ignored
I use a Box size: 2
Reversal: 5
I use all different time frames but 5 min chart is mainly for 10-20 pips.
Also, I only use pending orders. I identify the zones and place the order, even for the breakouts and breakdowns.
Hopes towards the summit can remain high through the week, but the choices are not pretty. Fiscal integration cannot be realized quickly. The ECB can definitely stabilize the situation by buying bonds en masse.....
[By forexcrunch] https://lh3.googleusercontent.com/-v...Y/s962/mt4.gif
The pair XAU/USD found support yesterday just above 1700 points and now
validated a return above 1725 points.
Indicators stay globaly bearish.
We stay neutral on the pair between 1725 and 1750.
We advise to wait an exit of this range to take position:
- Long if 1750 is broken. The breakout of 1775 points will give a new buy signal.
- Short if 1725 is broken. The breakout of 1700 will give a new sell signal.
[by ibtimes] https://lh3.googleusercontent.com/VF...HFXx-XMx7emPnY
...In the bigger picture, there is still no clear sign of long term trend reversal yet and price actions from 1923.7 would still be finally unfolded as correction/consolidation only. Though, the consolidation pattern would likely extend below 1923.7 for a while and rally attempt should face strong resistance near to this level. We'd anticipate another falling leg before such consolidation completes. And in such case, downside should be contained by 1478.3/1577.4 support zone...[by oilngold] https://lh3.googleusercontent.com/-1...LIQ/s576/1.PNG A t t a c h m e n t: