DislikedThanks anyways. It's very noble of you to post your work for free.
ErikIgnored
One final thing you might like to try......
Before attaching the indy:
Zoom out as far as possible (press the minus key), then press the End key, and finally Page Up about 5-6 times. This will load a good few pages of data for the current pair/TF, onto your hard drive, from your br0ker's servers.
Repeat for every TF (M1, M5, M15, etc) of every pair. So if your br0ker offers 25 pairs, you'd end up doing it 25 x 9 = 225 times.
Thankfully you need to do this process only once, to ensure that plenty of historical data is loaded for every pair/TF. Then attach the indy. Now that all the data is there, the plots should appear very quickly.
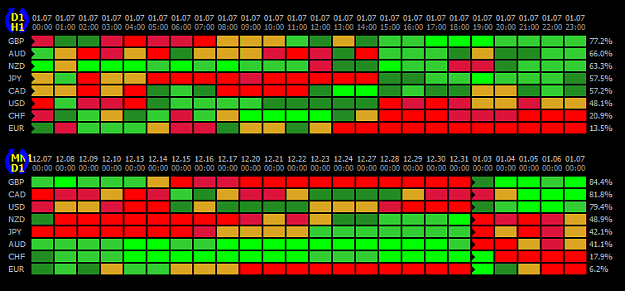
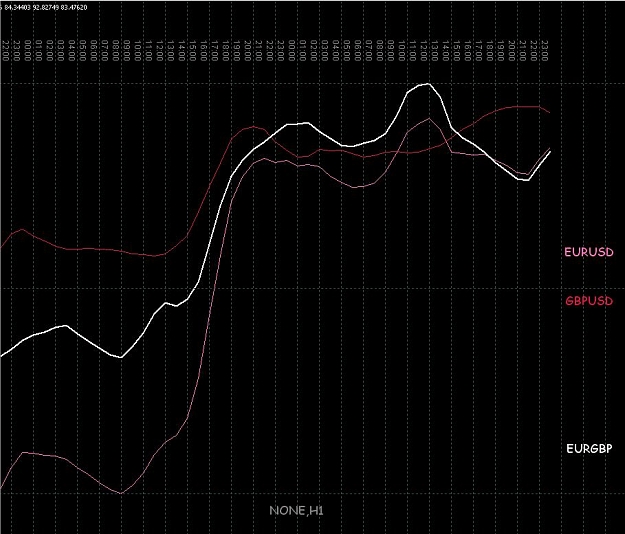
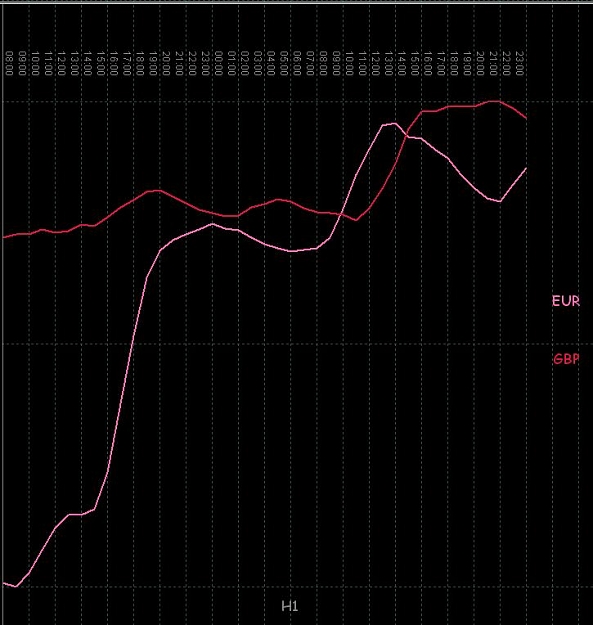
Otherwise the indy needs to load all of the data itself, a process which can take maybe 30 mins. Remember, each plot is a weighted average of every pair applicable for a currency, e.g. for AUD it's AUDUSD, AUDCHF, AUDJPY etc. So it needs to have the data for every pair, and for every TF you ask it to display.
If this doesn't fix the problem, then I'm stuck for ideas.
Good luck,
David