• Home
  • Forums
  • Trades
  • News
  • Calendar
  • Market
  • Brokers
  • Login
  • Join
  • User/Email: Password:
  • 5:41am
Menu
  • Forums
  • Trades
  • News
  • Calendar
  • Market
  • Brokers
  • Login
  • Join
  • 5:41am
Sister Sites
  • Metals Mine
  • Energy EXCH
  • Crypto Craft

Options

Bookmark Thread

First Page First Unread Last Page Last Post

Print Thread

Similar Threads

4 Hour Strategy Macd+other Indicator 21 replies

average true range for 1 hour and 4 hour charts 2 replies

X-1102 1 hour , 4 hour and daily Tf trades 7 replies

Create a verticle line at certain hour for every certain hour 16 replies

Is the "4 Hour Strategy (MACD)" the best system here at FF? 20 replies

  • Commercial Content
  • /
  • Reply to Thread
  • Subscribe
  • 12,927
Attachments: 4 Hour Strategy (MACD)
Exit Attachments
Tags: 4 Hour Strategy (MACD)
Cancel

4 Hour Strategy (MACD)

  • Last Post
  •  
  • 1 900901Page 902903904 1578
  • 1 Page 902 1578
  •  
  • Post #18,021
  • Quote
  • Nov 27, 2008 8:24am Nov 27, 2008 8:24am
  •  bshadroo
  • | Joined Apr 2007 | Status: Member | 1,126 Posts
wasnt this a good TC?
Attached Image (click to enlarge)
Click to Enlarge

Name: 1.gif
Size: 16 KB
 
 
  • Post #18,022
  • Quote
  • Nov 27, 2008 8:37am Nov 27, 2008 8:37am
  •  edeyj999
  • | Joined Jul 2008 | Status: Member | 126 Posts
Quoting bshadroo
Disliked
wasnt this a good TC?
Ignored
Perfectly good TC, IMO. However, the bearish candle looks not too good, but if you placed your stop loss below the signal candle then the trade should still be running. I notice the EU is rallying at the moment.
James The Beekeeper
 
 
  • Post #18,023
  • Quote
  • Nov 27, 2008 9:27am Nov 27, 2008 9:27am
  •  bshadroo
  • | Joined Apr 2007 | Status: Member | 1,126 Posts
Quoting edeyj999
Disliked
Perfectly good TC, IMO. However, the bearish candle looks not too good, but if you placed your stop loss below the signal candle then the trade should still be running. I notice the EU is rallying at the moment.
Ignored
yes but SL was at least 80pips and even if i divided my SL to 60 and 30 i'd loose so i decided to stay out
 
 
  • Post #18,024
  • Quote
  • Edited 11:29am Nov 27, 2008 9:46am | Edited 11:29am
  •  edeyj999
  • | Joined Jul 2008 | Status: Member | 126 Posts
Quoting bshadroo
Disliked
yes but SL was at least 80pips and even if i divided my SL to 60 and 30 i'd loose so i decided to stay out
Ignored
OK, so the size of the SL saved you from entry. All part of managing the trade.

Just making the point that the trade is still "live" as the price has yet to retrace lower than the signal candle. So it's not a "bad" signal just yet.

Edit: Oh well, it did go "bad" in the end. Just part of the wonders of Forex trading - you can't get them all correct!
James The Beekeeper
 
 
  • Post #18,025
  • Quote
  • Nov 27, 2008 11:38am Nov 27, 2008 11:38am
  •  Phillip Nel
  • | Commercial Member | Joined Nov 2006 | 2,223 Posts
Quoting bshadroo
Disliked
yes but SL was at least 80pips and even if i divided my SL to 60 and 30 i'd loose so i decided to stay out
Ignored

I am surprised to see the bearish candle after the TC. Luckily big stoploss kept me out.
 
 
  • Post #18,026
  • Quote
  • Nov 27, 2008 11:46am Nov 27, 2008 11:46am
  •  ekling
  • | Joined May 2006 | Status: Member | 162 Posts
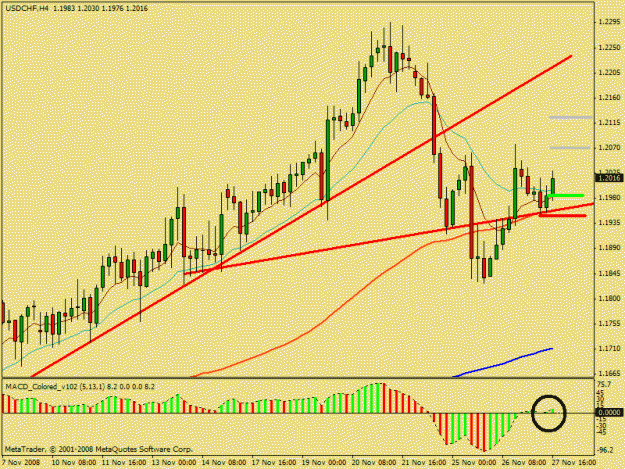
Took this one about 1½ hour ago..

Entry ---> 1.1984

SL---> 1.1947

PT1 ---> 1.2064

PT2 ---> 1.2115

Have moved both to BE after that bullish candle after the entry candle.
Attached Image (click to enlarge)
Click to Enlarge

Name: usdchf.gif
Size: 21 KB
 
 
  • Post #18,027
  • Quote
  • Nov 27, 2008 11:50am Nov 27, 2008 11:50am
  •  Phillip Nel
  • | Commercial Member | Joined Nov 2006 | 2,223 Posts
Quoting ekling
Disliked
Took this one about 1½ hour ago..

Entry ---> 1.1984

SL---> 1.1947

PT1 ---> 1.2064

PT2 ---> 1.2115

Have moved both to BE after that bullish candle after the entry candle.
Ignored

That was a good one to take. 89sma was the main support. 21ema above does not offer any resistance at all. Inverted sHs on the price
 
 
  • Post #18,028
  • Quote
  • Nov 27, 2008 11:56am Nov 27, 2008 11:56am
  •  ekling
  • | Joined May 2006 | Status: Member | 162 Posts
Im reading this book palmer have recommended on his website, japanese candlestick charting techniques, and i must say its extremely intresting reading material!

So for all you new guys in this thread, read that book, i think you'll find it very usefull.
 
 
  • Post #18,029
  • Quote
  • Nov 27, 2008 11:59am Nov 27, 2008 11:59am
  •  ekling
  • | Joined May 2006 | Status: Member | 162 Posts
Quoting Phillip Nel
Disliked
That was a good one to take. 89sma was the main support. 21ema above does not offer any resistance at all. Inverted sHs on the price
Ignored
Oh yeah, when you mention it theres a sHs on price. Actually i didnt even notice that! Well i thought it was a strong setup even without it so i went for it.

We also have a BoZ on the MACD as extra confirmation + very nice R:R.
 
 
  • Post #18,030
  • Quote
  • Nov 27, 2008 1:18pm Nov 27, 2008 1:18pm
  •  saka
  • | Joined Jul 2007 | Status: Macroeconomic trader | 498 Posts
I do meet some cases of failure TC of eu today, which price is apporaching resistant and forms a TC(usually the TC is a potential LH which the siganl green MACD bar is beneth previous ones), it would often be a failure TC and price forms a sHs for the effect of the resistant. Let's not forget the rhythm that when price approaching 8ema or 21ema, it has the rhythm to continue it's way to become a TC, but these failure TCs always the ones that price has leave the MAs already, and there is a distance to MAs, that's means the power of TC has been exasuted already, and the low leave of the green MACD TC signal bar ofthen followed by a red one to become a LH!

I use daily, 4h, 1h and 5min chart to show where the really entry point of TC trade today and if we do enter at 12:00 canlde where the failure of TC at 4h chart, how do we set the sl to cut down the potential loss.

Daily chart, where we see the resistant line
Attached Image (click to enlarge)
Click to Enlarge

Name: euday.gif
Size: 34 KB


4h chart, where we see the price has left 8ema with a distance alreay, and has the potential to form a nesting doll or sHs
Attached Image (click to enlarge)
Click to Enlarge

Name: eu4h.gif
Size: 34 KB


1h chart, where the successful tc entry point today is.
Attached Image (click to enlarge)
Click to Enlarge

Name: eu1h.gif
Size: 36 KB


5min, if we do enter at 12:00 of 4h failure TC, how should we set the SL to cut down potential loss
Attached Image (click to enlarge)
Click to Enlarge

Name: eu5min.gif
Size: 25 KB
Plan your trades and trade your plans
 
 
  • Post #18,031
  • Quote
  • Nov 27, 2008 1:58pm Nov 27, 2008 1:58pm
  •  bshadroo
  • | Joined Apr 2007 | Status: Member | 1,126 Posts
Quoting Phillip Nel
Disliked
I am surprised to see the bearish candle after the TC. Luckily big stoploss kept me out.
Ignored
yes ,and the shape of candles didnt convent me to divide my stoploss to 30 and 60
 
 
  • Post #18,032
  • Quote
  • Nov 27, 2008 3:51pm Nov 27, 2008 3:51pm
  •  hugozavala87
  • | Joined Nov 2007 | Status: Member | 9 Posts
what do you think about the head n shoulders on gbpusd
 
 
  • Post #18,033
  • Quote
  • Nov 27, 2008 4:29pm Nov 27, 2008 4:29pm
  •  BenStevo
  • | Joined Oct 2007 | Status: Member | 189 Posts
Quoting hugozavala87
Disliked
what do you think about the head n shoulders on gbpusd
Ignored
I wouldn't be rushing in to sell if that's what you mean...?
- 4hr steadily making higher lows.
- If you drop to 1hr, there is an ascending TL that price is respecting well, with 4 tests so far...my anticipation is still long.
- Also, if you look at daily, there is MACD divergence, and price has closed above 21EMA. Yesterdays 26th candle was a weak bearish retracement back towards 21. All signs to me to be wary of short trades.

...Just my plan of course. But I like to have a plan in advance otherwise I'm more likely to jump in on stupid trades .
Attached Image(s) (click to enlarge)
Click to Enlarge

Name: GU 27 nov H4.gif
Size: 30 KB
Click to Enlarge

Name: GU 27 nov H1.gif
Size: 33 KB
 
 
  • Post #18,034
  • Quote
  • Edited 2:46am Nov 28, 2008 2:06am | Edited 2:46am
  •  Yorik
  • | Joined Oct 2007 | Status: Member | 203 Posts
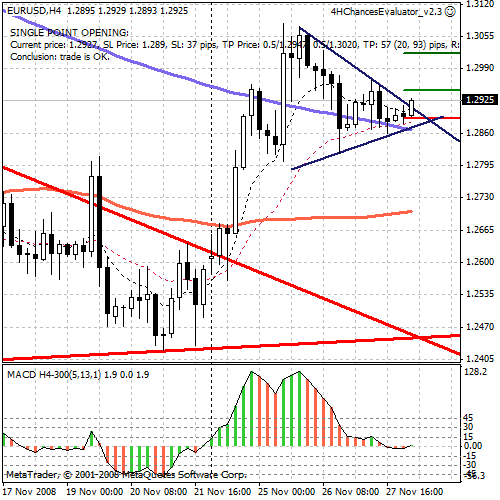
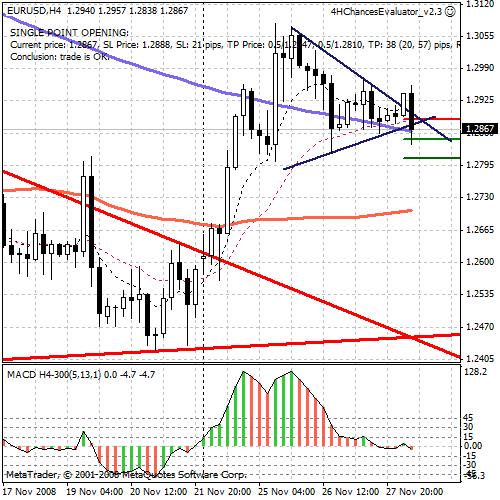
Bullish ZB, price broke upwards the upper border of triangle.

BUY 1.2938
SL 1.2890 (inside the triangle, 48 pips)
TP1 1.2957 (19 pips); TP2 1.3020 (82 pips), avTP 51 pips; RR>1

Anticipate possible retest of the broken resistance (up to 1.29).

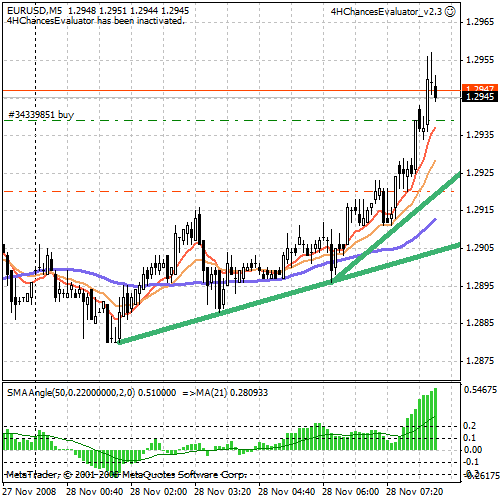
Edit1: ~20 min later - TP1 hit, 0.5*19 pips, SL of 2nd part moved to -19 pips (seems to be close to support line on 5min TF - see second image).

Edit2: 2nd part closed at -19 pips. Total = 0 pips.
Attached Images
 
 
  • Post #18,035
  • Quote
  • Nov 28, 2008 2:11am Nov 28, 2008 2:11am
  •  BenStevo
  • | Joined Oct 2007 | Status: Member | 189 Posts
I'm in with you. Nice 3 dojis before signal as well

Quoting Yorik
Disliked
Bullish ZB, price broke upwards the upper border of triangle.

BUY 1.2938
SL 1.2890 (inside the triangle, 48 pips)
TP1 1.2958 (20 pips); TP2 1.3020 (82 pips), avTP 51 pips; RR>1

Anticipate possible retest of the broken resistance (up to 1.29).
Ignored
 
 
  • Post #18,036
  • Quote
  • Nov 28, 2008 2:26am Nov 28, 2008 2:26am
  •  Cinema007
  • | Joined Jan 2008 | Status: Member | 26 Posts
http://www.forexfactory.com/attachme...1&d=1227857147
Attached Image (click to enlarge)
Click to Enlarge

Name: eur081128m5.gif
Size: 31 KB
 
 
  • Post #18,037
  • Quote
  • Edited 4:26am Nov 28, 2008 3:29am | Edited 4:26am
  •  time1300
  • | Joined Nov 2008 | Status: Keeping Life Simple | 292 Posts
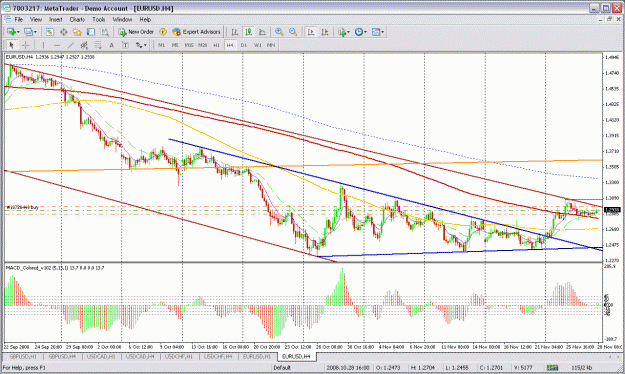
I also got into the trade

Reasons:
04:00 candle has given the TC signal
Last 2 candles a dojis followed by a nice engulfing bullish candle
Also price is close to a trend line
Price has stayed above the 200sma after crossing it and pulled back to it and now a possibility for bouncing off and maybe a breakout above the trend line
Also 21ema close to the 200sma and acting as support as well.

Will close 50% at just below trend line and move remainding to BE and give it a chance to breakout if it does.


Also the 2 charts are the same, one is zoomed in to see the candles and MACD signal more clearly. The other is zoomed out to see how I have drawn up the trend lines.

Edit:
Stopped out, price completely has gone against us. any suggestions anyone to whether this was just a bad trade or just one of those that just didn't work out. any suggestions would be appreciated.
Attached Image(s) (click to enlarge)
Click to Enlarge

Name: eurusd trade4h.gif
Size: 48 KB
Click to Enlarge

Name: eurusd trade4h zoom.gif
Size: 47 KB
Keeping Life Simple
 
 
  • Post #18,038
  • Quote
  • Nov 28, 2008 5:42am Nov 28, 2008 5:42am
  •  Pipsi cola
  • | Joined Feb 2007 | Status: Member | 134 Posts
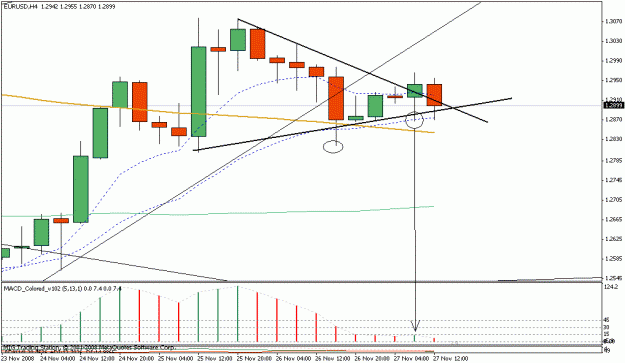
Can't find anything against this trade except that it looked too good to be true

PS Yorik's management was the best

Quoting time1300
Disliked
I also got into the trade

Reasons:
04:00 candle has given the TC signal
Last 2 candles a dojis followed by a nice engulfing bullish candle
Also price is close to a trend line
Price has stayed above the 200sma after crossing it and pulled back to it and now a possibility for bouncing off and maybe a breakout above the trend line
Also 21ema close to the 200sma and acting as support as well.

Will close 50% at just below trend line and move remainding to BE and give it a chance to breakout if it does.


Also the 2 charts are the same, one is...
Ignored
 
 
  • Post #18,039
  • Quote
  • Edited 6:24am Nov 28, 2008 5:54am | Edited 6:24am
  •  Yorik
  • | Joined Oct 2007 | Status: Member | 203 Posts
By the way - if it were a false breakout upwards - now I'm also considering possibilities of going short on EU.

Edit: I didn't enter - didn't like the hammer-like candle on 1H, decided either to pass or to enter if it retraces to the broken support.
Attached Image
 
 
  • Post #18,040
  • Quote
  • Nov 28, 2008 6:32am Nov 28, 2008 6:32am
  •  time1300
  • | Joined Nov 2008 | Status: Keeping Life Simple | 292 Posts
The 200sma worries me, whether its going to bounce of it or keeping going down. The 1H has done a breakout pullback and now testing lows, if it weren't for the 200sma, it would be a good entry. 4H MACD is giving Zero break signal as well.
Keeping Life Simple
 
 
  • Commercial Content
  • /
  • 4 Hour Strategy (MACD)
  • Reply to Thread
    • 1 900901Page 902903904 1578
    • 1 Page 902 1578
1 trader viewing now
  • More
Top of Page
  • Facebook
  • Twitter
About FF
  • Mission
  • Products
  • User Guide
  • Media Kit
  • Blog
  • Contact
FF Products
  • Forums
  • Trades
  • Calendar
  • News
  • Market
  • Brokers
  • Trade Explorer
FF Website
  • Homepage
  • Search
  • Members
  • Report a Bug
Follow FF
  • Facebook
  • Twitter

FF Sister Sites:

  • Metals Mine
  • Energy EXCH
  • Crypto Craft

Forex Factory® is a brand of Fair Economy, Inc.

Terms of Service / ©2023