Disliked{quote} No trading for me today but I hope to invite experienced comment on my charts. Not sure what I am doing here but here are some charts ( Dax and Cable) where I try to make sense of the open of the UK session. Grey circles on Cable are proposed 1 minute trades. Road map is still key but may be triggered earlier by UK open line action ? {image} {image} {image} {image}Ignored
With the changing of the session box came a quick rethink, still using the same principals. Wednesday was the final test day of these changes.
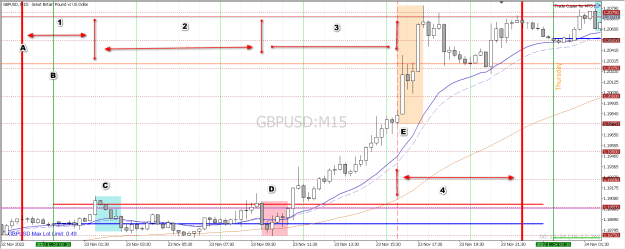
GU-M15-W11.23.2022
Attached Image (click to enlarge)
Some quick descriptions of the chart and my main changes.
Since I trade in SBurke's session gap during the US and Asian sessions I will sometimes go to the start of London or the EOD in the US. With the change in the session box size and start times I changed the parameters for the sessions.
1 - The Close-Open session.
2 - Asia
3 - London
4 - US
A - where I go flat.
B - 1700 EST NY close Works well on this GMT+2 chart. 0000 chart time = 1700 EST. No Sunday bars. This is the time zone all charts should be.
The equity open 90-minutes. Each session high and/or low is usually created in this period. While Blue and many others use only a 60-minute box for the session open, I can see advantages of the 90-minute box.
C - Asia
D - London
E - US
You can clearly see how the session boxes define the rest of that session. This fits perfectly with how I view the market. The day is broken into these 4 main portions with each one leading into and being the base for the following session. Then the US session defines the next day. The Close-Open period is the no go zone on the chart. and is often a range into Asia.
Mark ... Everything you have been told is a LIE
5