• Home
  • Forums
  • Trades
  • News
  • Calendar
  • Market
  • Brokers
  • Login
  • Join
  • User/Email: Password:
  • 11:09am
Menu
  • Forums
  • Trades
  • News
  • Calendar
  • Market
  • Brokers
  • Login
  • Join
  • 11:09am
Sister Sites
  • Metals Mine
  • Energy EXCH
  • Crypto Craft

Options

Bookmark Thread

First Page First Unread Last Page Last Post

Print Thread

Similar Threads

GBP/CHF and USD/CHF 951 replies

Correlation EUR/USD, USD/CHF, EUR/CHF (Humour me please... Thx) 8 replies

EUR/CHF, USD/CHF turning up? 1 reply

Using usd/chf - eur/usd correlation to see moves in EUR/USD 46 replies

Ranging pairs? EUR/CHF, EUR/GBP, AUD/CAD? 0 replies

  • Interactive Trading
  • /
  • Reply to Thread
  • Subscribe
  • 930
Attachments: EUR/CHF
Exit Attachments

EUR/CHF

  • Last Post
  •  
  • 1 736737738Page 739740 741
  • 1 Page 739 741
  •  
  • Post #14,761
  • Quote
  • Apr 9, 2021 4:58am Apr 9, 2021 4:58am
  •  ChiForex
  • Joined Jan 2019 | Status: Member | 1,024 Posts
Watch a base above 1.1010 is essential to trigger the upward movement, or else monthly support might still be target before bouncing up again..

We're already ready for 1.0970-80s possibility anyways as said before, don't panic hold on strong
My technical analysis leading trades depend on Daily/Weekly/Monthly Chart
 
 
  • Post #14,762
  • Quote
  • Apr 14, 2021 6:23pm Apr 14, 2021 6:23pm
  •  ChiForex
  • Joined Jan 2019 | Status: Member | 1,024 Posts
As expected a week ago, here we are more than 60 pips up in one day

The pair may face a retrace down to around 1.1030 while would face resistance on upside around 1.1085 if reaches there.
My technical analysis leading trades depend on Daily/Weekly/Monthly Chart
 
 
  • Post #14,763
  • Quote
  • Apr 16, 2021 6:21am Apr 16, 2021 6:21am
  •  ChiForex
  • Joined Jan 2019 | Status: Member | 1,024 Posts
After much support yesterday at 1.1030 first weekly support, breaking it freed the pair down to second weekly support and more important one around 1.1010 that I talked about before where 60 pips move started.
Bulls are in threat as 1.1010 broke to 1.1000 psychological level that can be a sign of further weakness.
The whole game is played on weekly around 1.1010 where bulls will try closing above and way better if they can locate price around 1.1030 or above
While bears looking at a close below 1.1010, on daily expected to find support above or around 1.1990s
In general, the pair looking to consolidate on short term until this weekly candle close and next week one clear the bigger picture.
My technical analysis leading trades depend on Daily/Weekly/Monthly Chart
 
 
  • Post #14,764
  • Quote
  • May 4, 2021 5:25pm May 4, 2021 5:25pm
  •  ChiForex
  • Joined Jan 2019 | Status: Member | 1,024 Posts
Big opportunity on this pair for a heavy buy at current level since had good support at past down to nearby 1.0950s and always bounced up from here to at least 1.11
Besides, daily and weekly are in oversold zone already and Monthly at the retrace zone although previous month bearish candle.
Just follow good money management and the reward seems promising.
My technical analysis leading trades depend on Daily/Weekly/Monthly Chart
 
 
  • Post #14,765
  • Quote
  • Jun 25, 2021 10:57am Jun 25, 2021 10:57am
  •  Ryang123
  • | Joined Jun 2017 | Status: Member | 27 Posts
I love trading this pair. Its probably one of the easiest to trade. Just wait for spikes when there is no news and fade them. Pick up 10-25 pips every time.
 
 
  • Post #14,766
  • Quote
  • Edited Jun 30, 2021 1:40am Jun 29, 2021 3:01pm | Edited Jun 30, 2021 1:40am
  •  ChiForex
  • Joined Jan 2019 | Status: Member | 1,024 Posts
That's true to an extent. The pair had been on downtrend for long weeks, you can't but bought lower and lower and at specific hours or else you'll get stuck with a loss floating order while a sell at those levels is a no.
Just from 18th June the pair looked trying to create an upward base, but got stuck in sideways movement for 10 days now!!
Looking at the candles only you'll say very easy just buy at same levels then it goes up but knowing the history movement of this pair, you wait for better lower entry that's not f***ing coming.
I prefer it go back to its downtrend movement behavior, at least predictable!
My technical analysis leading trades depend on Daily/Weekly/Monthly Chart
 
 
  • Post #14,767
  • Quote
  • Jul 2, 2021 3:28pm Jul 2, 2021 3:28pm
  •  ChiForex
  • Joined Jan 2019 | Status: Member | 1,024 Posts
Look today what happened..as I said before..the pair held for 2 weeks up turning stupid levels from 1.0955 to 1.0965 to supports and reaching 1.0986 high, then in few hours today it crashed all good supports 1.0950 1.0940 1.0930 and now below, although looking at EU and UC movements, EC mustn't have dropped this much, maybe Max. 1.0935-40
Too much speculation on this pair vs SNB, maybe their devices figured that SNB went to sleep..lol
My technical analysis leading trades depend on Daily/Weekly/Monthly Chart
 
 
  • Post #14,768
  • Quote
  • Jul 8, 2021 3:41pm Jul 8, 2021 3:41pm
  •  ChiForex
  • Joined Jan 2019 | Status: Member | 1,024 Posts
What a bullshit SNB watching at London Open EC fall 80 pips in 2 hours!!! Seems from 2015 Jordan continuing with his SNB colleagues their no credibility!
My technical analysis leading trades depend on Daily/Weekly/Monthly Chart
 
 
  • Post #14,769
  • Quote
  • Jul 8, 2021 4:46pm Jul 8, 2021 4:46pm
  •  Erebus
  • Joined Jul 2011 | Status: Member | 6,743 Posts
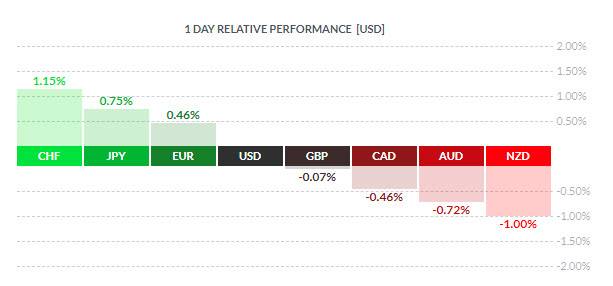
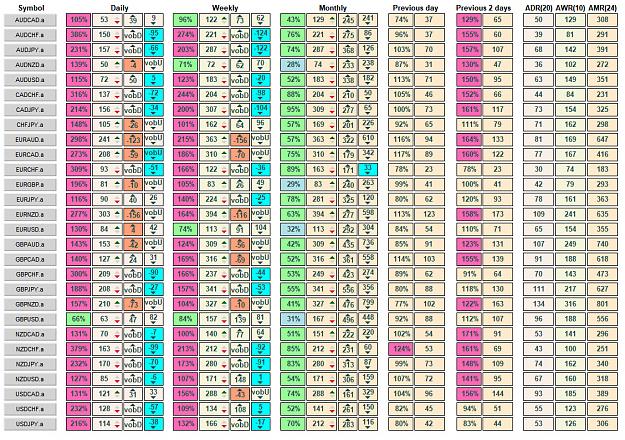
Risk-off day, but stock markets didn't do too bad

Attached Image
Attached Image (click to enlarge)
Click to Enlarge

Name: 2021-07-09_6-40-25.jpg
Size: 568 KB
Don't trade your heart, trade your chart!
4 Daily Signals All Time Return: 14.3%
 
 
  • Post #14,770
  • Quote
  • Edited at 7:35pm Jul 8, 2021 7:23pm | Edited at 7:35pm
  •  emmzett
  • Joined Apr 2008 | Status: Member | 572 Posts
Quoting ChiForex
Disliked
What a bullshit SNB watching at London Open EC fall 80 pips in 2 hours!!! Seems from 2015 Jordan continuing with his SNB colleagues their no credibility!
Ignored
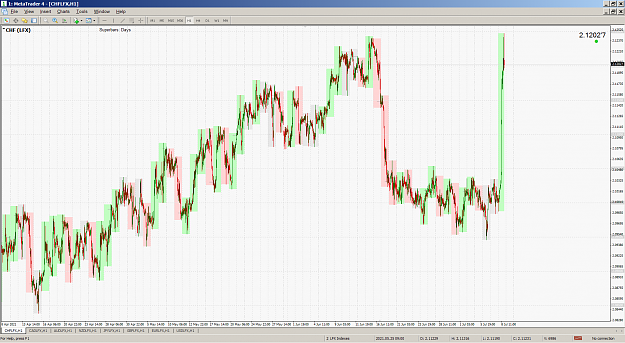
I was looking for the source of the sudden volatility across the board. Currencies, futures, indexes ... today everything went crazy. Without news, without anything. Not that there were no signs at the wall. Signs for vulnerable market structure and a looming correction became visible already one week ago (last Friday). But here we have the source of the craziness, and interestingly it happened in a single day (yesterday). Someone with very deep pockets became very nervous - and made the whole market roll-over. I trade for about 20 years and can't remember having seen such a move. There were bigger ones, sure. But the structure today I haven't seen before.
Attached Image (click to enlarge)
Click to Enlarge

Name: CHF Index.png
Size: 97 KB

edit: This was surely not the SNB. But someone with very very deep pockets.
 
 
  • Post #14,771
  • Quote
  • Jul 9, 2021 12:12am Jul 9, 2021 12:12am
  •  ChiForex
  • Joined Jan 2019 | Status: Member | 1,024 Posts
Quoting emmzett
Disliked
{quote} I was looking for the source of the sudden volatility across the board. Currencies, futures, indexes ... today everything went crazy. Without news, without anything. Not that there were no signs at the wall. Signs for vulnerable market structure and a looming correction became visible already one week ago (last Friday). But here we have the source of the craziness, and interestingly it happened in a single day (yesterday). Someone with very deep pockets became very nervous - and made the whole market roll-over. I trade for about 20 years...
Ignored
Similar thoughts hadn't seen such unexpected out of the blue move from long time for such limited movement pair, at least not without any reason any news!
I'm not accusing SNB of being behind it but of not preventing such speculations or whatever named, especially after it always mentions about monitoring the market and intervening to curb chf strength.
The scandal was that it happened in London Open not some low volatility off hours, then when was SNB supposed to monitor if not more in main market sessions.
My technical analysis leading trades depend on Daily/Weekly/Monthly Chart
 
1
  • Post #14,772
  • Quote
  • Jul 9, 2021 12:28am Jul 9, 2021 12:28am
  •  ChiForex
  • Joined Jan 2019 | Status: Member | 1,024 Posts
There are many unexplainable points in SNB behavior that seems more related to deceiveness. Like in 2015 they kept assuring 1.20 till last days then suddenly they let it go, and now similar thing happening, looks like the truth as said that as much as they shout and emphasize it means they are out of control, but that is loosing them more credibility.
Curbing chf strength don't happen by words but in monetary policy like why not give hints of -1 or -2% rate change if not implement it too.
Besides, they go defending non technical levels then from nowhere they let technical levels get crashed in no time!
Like yesterday, no one could imagine seeing 1.0890 to even 1.0865 all get crashed in no time!!
Seems those guys in SNB board don't know how to handle it, all need a change once and for all.
My technical analysis leading trades depend on Daily/Weekly/Monthly Chart
 
 
  • Post #14,773
  • Quote
  • Jul 9, 2021 2:36am Jul 9, 2021 2:36am
  •  pips4life
  • Joined Apr 2007 | Status: Member | 828 Posts | Invisible
The abrupt EC fall in Jan 2015 was in mere hours, and was between 2300 and 3500 pips, depending on what broker feed you look at. There was no liquidity, and it damn near broke all of Forex. Why? Brokers give us leverage because a big move in currency is 1-2% in a day. The EURCHF moved 20-30% and hurt some major brokers who weren't covered for that fall.

The CHF bankers wanted EC to go up (i.e. weaker CHF). They just got tired of fighting the collective flight to their so-called "safe" currency. CHF strengthened hugely overnight... but EC did bounce back up from whence it came, only to then spend the next few years going down again (i.e. CHF stronger, much to the disappointment of their bankers trying to defend their exporters).

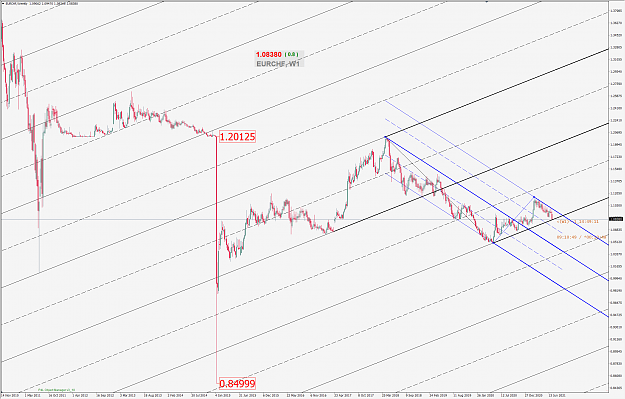
Why the recent move down? I see a fight between the black Pitchfork going up, and the blue PF going down. Blue has been holding for a few weeks, and some would say "coiling", getting primed for exactly the (beginning of a...??) strong move down that it did. However, so far, it got driven down to meet the black PF, which has some decent previous resonance, but it's now at a decision point. I don't have a strong opinion either way, as a case can be made for either up or down from here.

The black PF has it's first pt1 ("A") at the weekly close before it made a huge gap opening much higher. That's not a typical "A" to use, but it has some resonance around the whole chart and is interesting. Given the huge disparities among brokers for where the Jan 2015 low occurred, I wouldn't be comfortable to base any PF off that low; so I pick another more recent and less volatile pivot, but have shifted it forward a bit as described to the close-before-gap-open.
Attached Image (click to enlarge)
Click to Enlarge

Name: 2021-07-09_0-10-54.png
Size: 115 KB
 
 
  • Post #14,774
  • Quote
  • Jul 9, 2021 6:52am Jul 9, 2021 6:52am
  •  ChiForex
  • Joined Jan 2019 | Status: Member | 1,024 Posts
Nice chart dude, didn't expect that PF have this influence, maybe add it to my trading arsenal but not sure if it's the reason that price stopped there or just a coincident.
Look now how it got stuck again at trading way it usually does sideways of 10-20 pips after unnecessary big crash.
The point wasn't if it could reach 1.0825 but how it did it in 2 hours!!
Anyways, expecting a retrace back to near 1.0880 on daily, weekly don't seem can close below current 1.0840s but also below 1.0895 and monthly above 1.0790 nearby with 1.0930 resistance. Looks consolidation btw those levels until month end.
My technical analysis leading trades depend on Daily/Weekly/Monthly Chart
 
 
  • Post #14,775
  • Quote
  • Jul 16, 2021 5:13am Jul 16, 2021 5:13am
  •  Dave7878
  • | Commercial Member | Joined Sep 2018 | 63 Posts
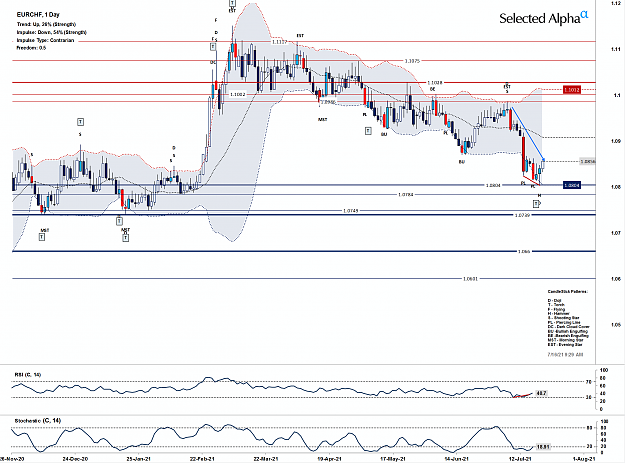
EURCHF shoots up after forming perfectly formed daily Hammer and Torch Reversal - all backed up by clear bullish divergence on the daily RSI indicator
Attached Image (click to enlarge)
Click to Enlarge

Name: eurchf-technical-analysis-chart-selected-alpha-16-11.png
Size: 170 KB
 
 
  • Post #14,776
  • Quote
  • Jul 18, 2021 6:18am Jul 18, 2021 6:18am
  •  ChiForex
  • Joined Jan 2019 | Status: Member | 1,024 Posts
Don't be very optimistic, it can go again to test 1.0860s that I expect to become the initial resistance on weekly new candle, and reverse back down to 1.0820s the least, as RSI can turn from 50 and Stoch still below 20.
However, might breath until month end as can retrace on monthly to resistance 1.0890s, still I favor consolidation.
If price can base above 1.0860s, we have 1.0890s.
The fall was too early at month first week, still we have 2 weeks to go. Below 1.0800 is very bearish and above 1.0890s and the better 1.0920s might give hope for bulls in August. Trade within those levels setting your TP and SL accordingly.
My technical analysis leading trades depend on Daily/Weekly/Monthly Chart
 
 
  • Post #14,777
  • Quote
  • Jul 19, 2021 1:18pm Jul 19, 2021 1:18pm
  •  ChiForex
  • Joined Jan 2019 | Status: Member | 1,024 Posts
Not long ago here we are 1.0820s
My technical analysis leading trades depend on Daily/Weekly/Monthly Chart
 
 
  • Post #14,778
  • Quote
  • Jul 20, 2021 10:22am Jul 20, 2021 10:22am
  •  tiborf71
  • Joined Apr 2011 | Status: rookie | 3,040 Posts
I'm in a long position now.
1.08416.
because I think it will rise.
 
 
  • Post #14,779
  • Quote
  • Edited at 3:34am Jul 21, 2021 2:53am | Edited at 3:34am
  •  ChiForex
  • Joined Jan 2019 | Status: Member | 1,024 Posts
Rise..lol I wouldn't bet on my socks It can go back all the way down to yesterday low if not lower, now have break of 1.0840 to confirm. Yesterday was unnecessary up move, couldn't even break 1.0857, so how can it break 1.0865-70 to reach 1.0890s

*EC trying to form support above 1.0840 but I wouldn't bet on that as 1.0857-60s nearby, not good R-R ratio, around 1.0820 and lower better bet
My technical analysis leading trades depend on Daily/Weekly/Monthly Chart
 
 
  • Post #14,780
  • Quote
  • Jul 21, 2021 6:45am Jul 21, 2021 6:45am
  •  tiborf71
  • Joined Apr 2011 | Status: rookie | 3,040 Posts
I analyze differently, I don’t care about magical fracture levels.
lol.
 
 
  • Interactive Trading
  • /
  • EUR/CHF
  • Reply to Thread
    • 1 736737738Page 739740 741
    • 1 Page 739 741
0 traders viewing now
  • More
Top of Page
  • Facebook
  • Twitter
About FF
  • Mission
  • Products
  • User Guide
  • Media Kit
  • Blog
  • Contact
FF Products
  • Forums
  • Trades
  • Calendar
  • News
  • Market
  • Brokers
  • Trade Explorer
FF Website
  • Homepage
  • Search
  • Members
  • Report a Bug
Follow FF
  • Facebook
  • Twitter

FF Sister Sites:

  • Metals Mine
  • Energy EXCH
  • Crypto Craft

Forex Factory® is a brand of Fair Economy, Inc.

Terms of Service / ©2022