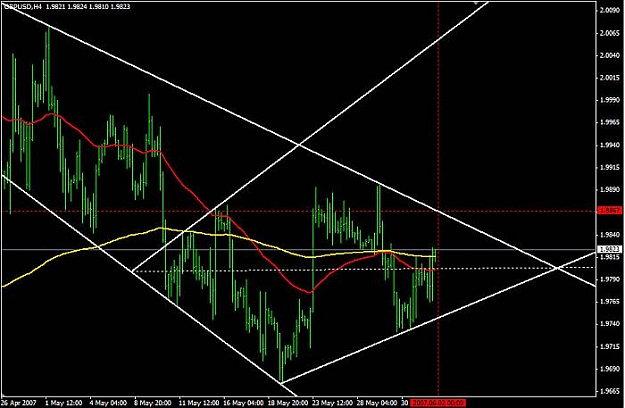
following on an old post about the diamond pattern, see the chart below.
monday's high should be around 1.9867, then we'll have a break, up or down.
for who is not familiar with the pattern, it is briefly explained here and here; the last one also talks about possible targets:
- if it breaks upwards, technical TP is @ 2.0089
- if it breaks downwards, technical TP is in 1.9550 area
by the way, notice how 50 EMA (red) is below 200 EMA (yellow), which suggest that a break upwards would be tough - although 50 EMA points upwards and last candle closed above 200 EMA...
care to comment on this?
Attached Image (click to enlarge)
Nihil Sine Deo.