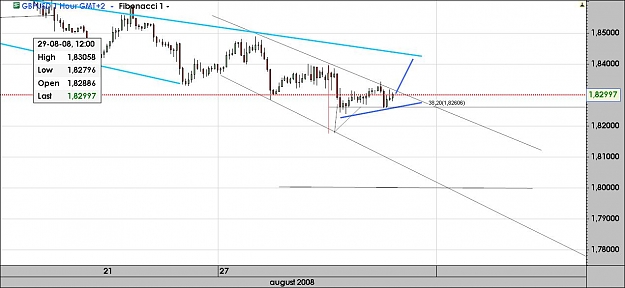
Hourly chart below, you can see that cable found resistance earlier in session at those previous swing lows (white dotted lines) and the underside of the breeched ascending supp t/line (red solid line)
Question now is whether the L circled turns out to be higher than the last LL of the downtrend, this might be confirmed by a breech of the last LH at 8345 area. Or is the downtrend still intact??
Time will tell,
G/L all
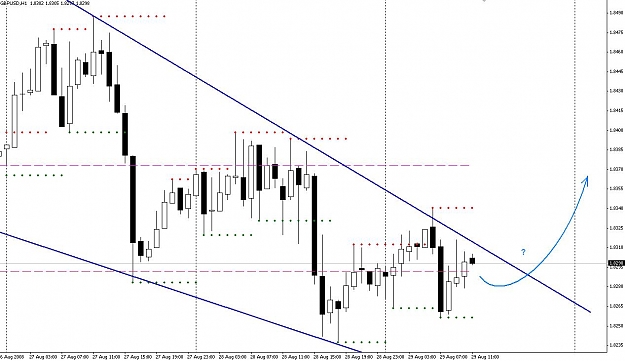
Question now is whether the L circled turns out to be higher than the last LL of the downtrend, this might be confirmed by a breech of the last LH at 8345 area. Or is the downtrend still intact??
Time will tell,
G/L all
Attached Image
ex member