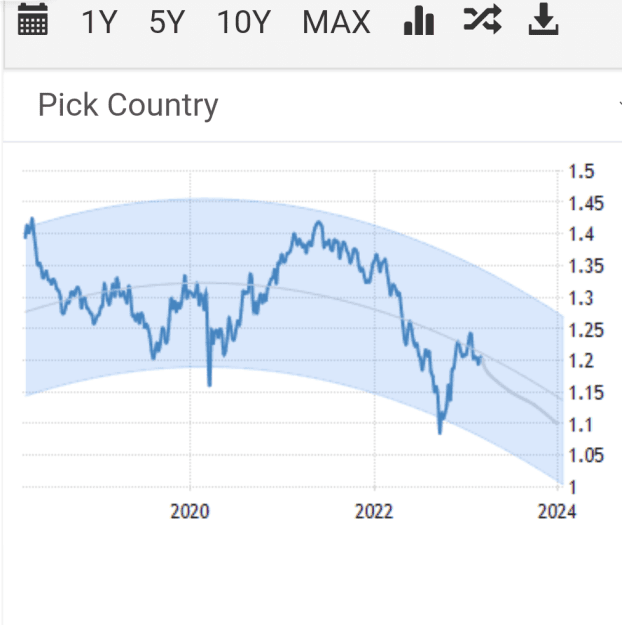
13th to 17th March it will likely be either of these two prices 1.2196 versus 1.1723... ✓1.2196 minus 350 = 1.1846 ✓1.1723 plus 350 = 1.2073 *Below 1.1846 invalidates 1.2196 *Above 1.2073 invalidates 1.1723 1.1960 is the average price and the most likely price to be touched. Expected Range for this coming week is 350 pips. A research excerpt with no obligation to follow.
Ignored
A research excerpt expert with no obligation to follow
13th to 17th March it will likely be either of these two prices 1.2196 versus 1.1723... ✓1.2196 minus 350 = 1.1846 ✓1.1723 plus 350 = 1.2073 *Below 1.1846 invalidates 1.2196 *Above 1.2073 invalidates 1.1723 1.1960 is the average price and the mostlikelypricetobetouched. Expected Range for this coming week is 350 pips. A research excerpt with no obligation to follow.
Ignored
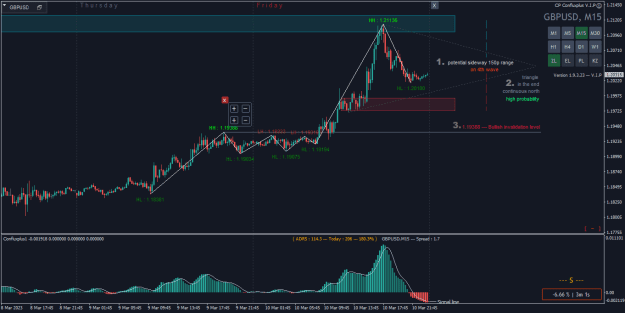
We nearly have a confluence, 1.1965 is my defence line for a push to 1.2155-1.22 area.
Last week's unemployment rate release was bad for the dollar, I expect the same for CPI since both data is correlated.
Whose goods are you going to consume with your broke a$$?😂
{quote} We nearly have a confluence, 1.1965 is my defence line for a push to 1.2155-1.22 area. Well done for the research, Baba. JereMi.
Ignored
Yes mate, totally agree with that 1.1965 being a defense line for a push towards 1.2155 - 1.22 area...
On the second thought, if you check the weekly candle this year, you will see a case of lower highs and lower lows. Which is to an extent tilting towards a bearish move to 1.16 axis.
On the third note, this March is the last month of the first quarter and each quarter usually averages 700 - 850 pips range, so far we are just 645 pips range which means there is still 55 to 200 more pips to equate the average expected range for a quarter with just 15 trade days left...
This takes it down to this simulations...
Average expected range for a quarter 700 - 850pips (making use of 800 pips)
1.2445 minus 800 pips = 1.1645
1.1802 plus 800 pips = 1.2602...
Current price being 1.2031 is
✓570 pips away from 1.2602
✓387 pips away from 1.1645...
While expected March range is between 500 - 650 pips ... March will have to do 800 pips range to attain 1.26, while March will have to do 470 pips range to attain 1.1645 as it stands...
The clue is relatively clear... I will stay bearish as far as 1.2215 is not breached for a target of 1.1645...
{quote} Yes mate, totally agree with that 1.1965 being a defense line for a push towards 1.2155 - 1.22 area... On the second thought, if you check the weekly candle this year, you will see a case of lower highs and lower lows. Which is to an extent tilting towards a bearish move to 1.16 axis. On the third note, this March is the last month of the first quarter and each quarter usually averages 700 - 850 pips range, so far we are just 645 pips range which means there is still 55 to 200 more pips to equate the average expected range for a quarter...
Ignored
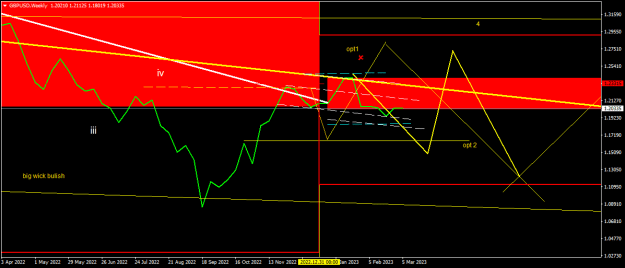
Looking at my weekly chart, this week will determine what side we shall lean towards. Bulls strongly rejected an old support. Please note that the highs of this range formed EQs just below the weekly supply. So that 800 range seems far but it's still in play. Let's wait and see.
{quote}You have no point, stop trying to act smart, your a losing retail trader who spends all day saying what can happen. Yes you can be right in a binary outcome 50% of the time!
I want to take back my 120 pips loss of last week, which necessitated this research work on GBPUSD.. I feel it may be useful to traders here. As always, no obligation to follow. Last 10 Months first 13 trade days range ✓485 pips ✓595 pips ✓395 pips ✓918 pips* ✓570 pips* ✓387 pips ✓290 pips ✓421 pips ✓686 pips ✓480 pips ✓200 pips ✓437 pips Most Repeated and expected: 395 - 480 pips Simulations for 13 - 17th March ✓1.2113 - 395 pips = 1.1718 ✓1.1801 +...
Ignored
Thank you for sharing your research George! That effort is a real service to this forum.
I'd be interested in knowing the same data of the first three months of each year. We're only three weeks away from finishing the first quarter of the year. What is the average range of first quarters and what would be the anticipated high and low this quarter?
{quote} Thank you for sharing your research George! That effort is a real service to this forum. I'd be interested in knowing the same data of the first three months of each year. We're only three weeks away from finishing the first quarter of the year. What is the average range of first quarters and what would be the anticipated high and low this quarter?
Ignored
Thanks for the positive feedback... As I stated in the post that a quarter usually has average of 700 to 850 pips range, so the above simulation is for this current quarter (January to March) the possible high and low cannot be clearly known but simulations can be made once 60% of the expected range of a quarter has already happened. Though some quarters have much bigger ranges in cases of unusual fundamentals.
As for this current quarter, it is pointing at either 1.26 or 1.16 to happen and we have just 3 weeks left. Next quarter starts in April to June which will have similar range average and not forgetting cases of overblown ranges.
{quote} Thanks for the positive feedback... As I stated in the post that a quarter usually has average of 700 to 850 pips range, so the above simulation is for this current quarter (January to March) the possible high and low cannot be clearly known but simulations can be made once 60% of the expected range of a quarter has already happened. Though some quarters have much bigger ranges in cases of unusual fundamentals. As for this current quarter, it is pointing at either 1.26 or 1.16 to happen and we have just 3 weeks left. Next quarter starts...
{quote} Yes, I don't use any indicators for SR lines. Actually if we see price action, price reversal areas are figured differently for Bullish or Bearish moves. What I have figured and got successful is that...Price always range in some defined range...After fundamentals change (like Interest Rate...CPI...Employment Data...Officials Talks) that range is broken and new range is created... and Price again gets in new range until new fundamental change. Please see in the picture (I trade EURUSD)...vertical lines are drawn at
Ignored
...
Ignored
Many thanks for your answer in detail. Looks like you've learned good stuff from all three brilliant tradersv and combined a good strategy together. I wish you the biggest trading success.
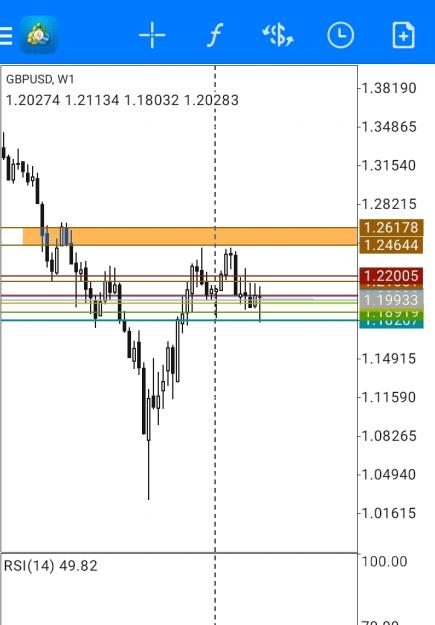
Drawing lines from monthly, weekly time frames is a good inside where the price will be rejected or moved into the next box. I've learned this form one trader tutorial I follow.
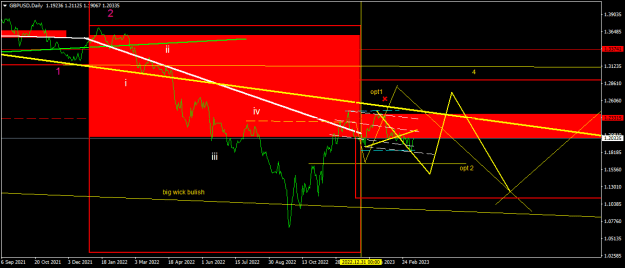
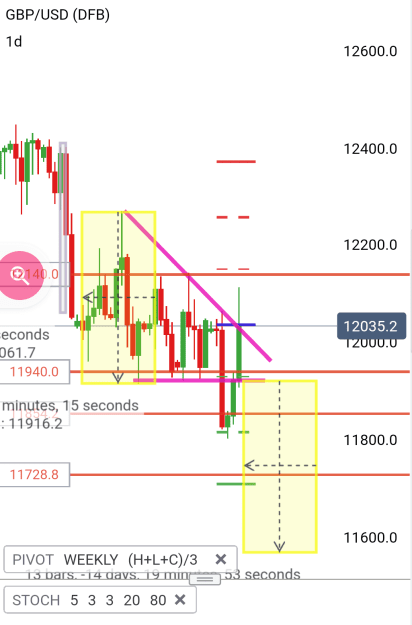
Daily chart broke down, retested, broke up, and returned back. To me direction is still bearish as daily 1.2140 was not breached.
Weekly - 1.2270
Monthly -1.24
Attached Image (click to enlarge)
Thanks Indigo.
This is only shared opinion, I will never expect anyone to follow.
Hello all 🙂🍀 Activate selling mode 2030 till 1.17001.1650 will add more if go highera, medium term trade 🍀
Ignored
Like previous posts of mine Im added higher 2100 some positions, some closed, some floating at plus, shity 2030 till 2050 closed with small profit, targets still ramain till we dont break 2110, happy trading week for everyone🍀🫶
People don't plan to lose. They lose because they don't plan.
{quote}{quote} Many thanks for your answer in detail. Looks like you've learned good stuff from all three brilliant tradersv and combined a good strategy together. I wish you the biggest trading success. Drawing lines from monthly, weekly time frames is a good inside where the price will be rejected or moved into the next box. I've learned this form one trader tutorial I follow. Daily chart broke down, retested, broke up, and returned back. To me direction is still bearish as daily 1.2140 was not breached. Weekly - 1.2270 Monthly -1.24 {image} Thanks...
Ignored
Hi J!
Good to hear I have your lots with me 🥰 I hope you are doing so well, cheers!🍀💪
People don't plan to lose. They lose because they don't plan.
{quote} Like previous posts of mine Im added higher 2100 some positions, some closed, some floating at plus, shity 2030 till 2050 closed with small profit, targets still ramain till we dont break 2110, happy trading week for everyone🍀🫶
{quote}{quote} Many thanks for your answer in detail. Looks like you've learned good stuff from all three brilliant tradersv and combined a good strategy together. I wish you the biggest trading success. Drawing lines from monthly, weekly time frames is a good inside where the price will be rejected or moved into the next box. I've learned this form one trader tutorial I follow. Daily chart broke down, retested, broke up, and returned back. To me direction is still bearish as daily 1.2140 was not breached. Weekly - 1.2270 Monthly -1.24 {image} Thanks...
Ignored
Absolutely spot on Jolita... 1.2270 stays intact on weekly, 1.24 stays intact on monthly, 4 hours chart showing lower highs and lower lows...