Joined Apr 2020
|
Status: stopped posting to cable thread
|6,722 Posts
... U.s NFP surprised to the upside last time, despite a bad Jolts a few days before. This time we have a good Jolts with an upside revision to that bad number. Will ADP forecast today support that good Jolts number? If so will this be instructive re NFP? This site (so far) going for +190k jobs against +263k last time.
Fed almost certainly at least +0.75% but the statement will be interesting re future rises. Boe +0.75% a chance or maybe just +0.5% ?
------------------------------------
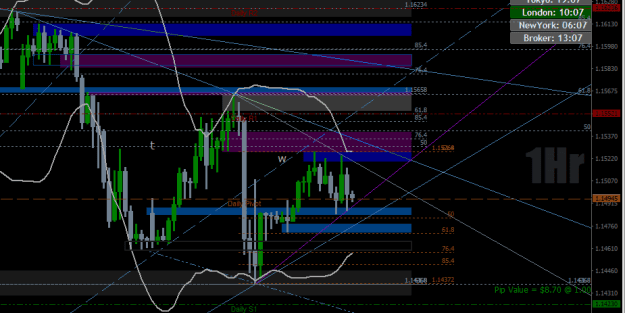
meantime,
1hr below
Attached Image (click to enlarge)
Intraday swing trader @ 30min+ supp/res, & 5min+ sbr/rbs, via 1min+ set-ups
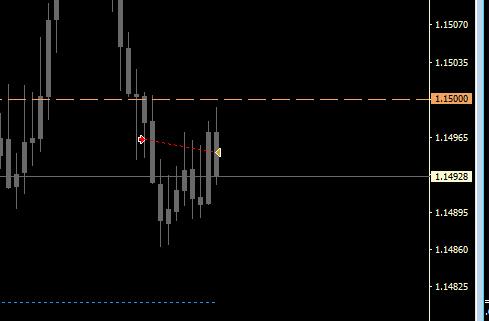
{quote} Yes, I can see what you are saying. The Daily Open line at about 1480 could also be a problem for my sell, and if it gets there, I may close there. It doesn't look very happy to go down and I will take a small loss if necessary
Ignored
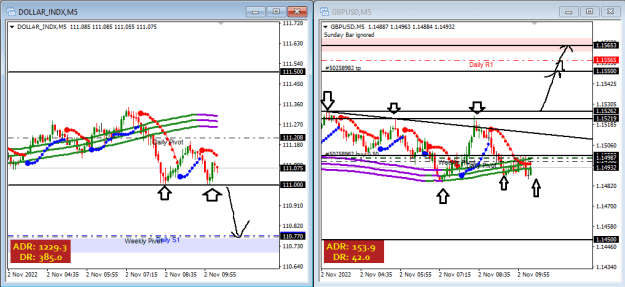
USDX is mounting another attack at 111.00 so I closed GU for +1 pip!
This M5 chart
I think I will go to my bed now, and I will take my Covid with me. I think I'm going to embrace this little bug and be nice to it, so that it will be nice to me also. We are both doing what we are here to do, so I must respect the bug and when it leaves me, I will be stronger.
Maybe I can try some Tokyo luck tomorrow, it depends how I feel. Night night all, trade well and make lots of pips
Attached Image (click to enlarge)
I am neither brave nor stupid...I am just a part time trader
Joined Dec 2011
|
Status: Postmaster
|11,928 Posts
I'm just presenting another way of looking at the market. I think diversity is good and necessary.
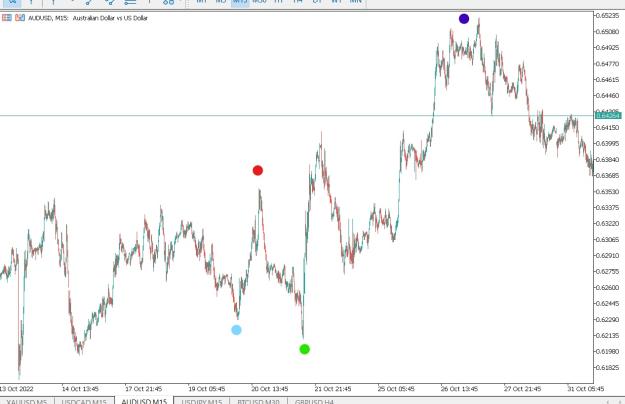
Detecting and recognizing patterns.
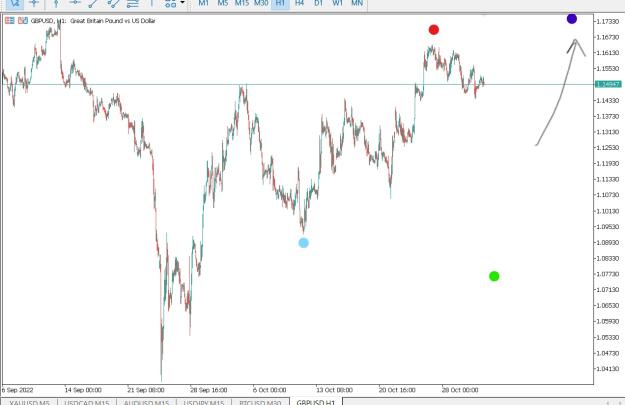
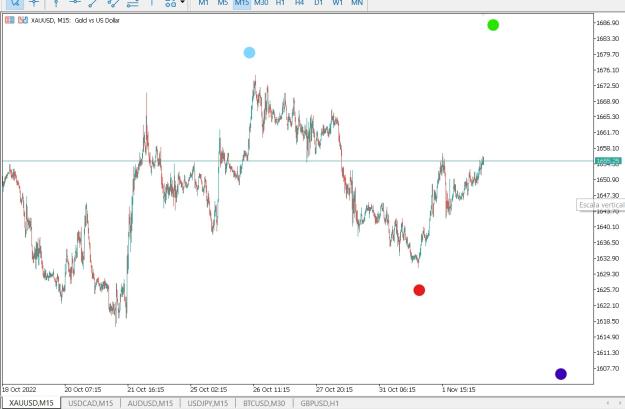
GU ´s dark blue dot represents to be higher, outside the frame. I may be wrong
I'm just presenting another way of looking at the market. I think diversity is good and necessary. Detecting and recognizing patterns. GU ´s dark blue dot represents to be higher, outside the frame. I may be wrong {image}{image}
Ignored
Dot green to blue should be more aggresive and fast.
{quote} USDX is mounting another attack at 111.00 so I closed GU for +1 pip! This M5 chart I think I will go to my bed now, and I will take my Covid with me. I think I'm going to embrace this little bug and be nice to it, so that it will be nice to me also. We are both doing what we are here to do, so I must respect the bug and when it leaves me, I will be stronger. Maybe I can try some Tokyo luck tomorrow, it depends how I feel. Night night all, trade well and make lots of pips {image}
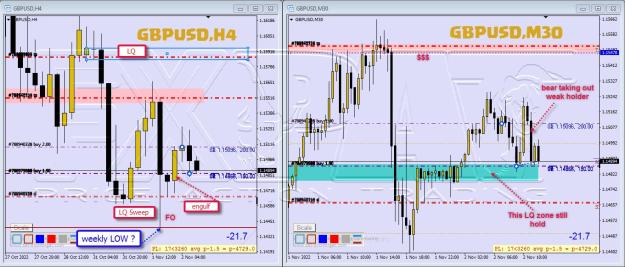
{quote} GU All above water going for target. Partial TP along the way to target.{image} NOTE : 1st Trade based on BO N3 and it failed, thus taking the small LQ below. 2ns Trade based on PB N3 to LQ zone.
Ignored
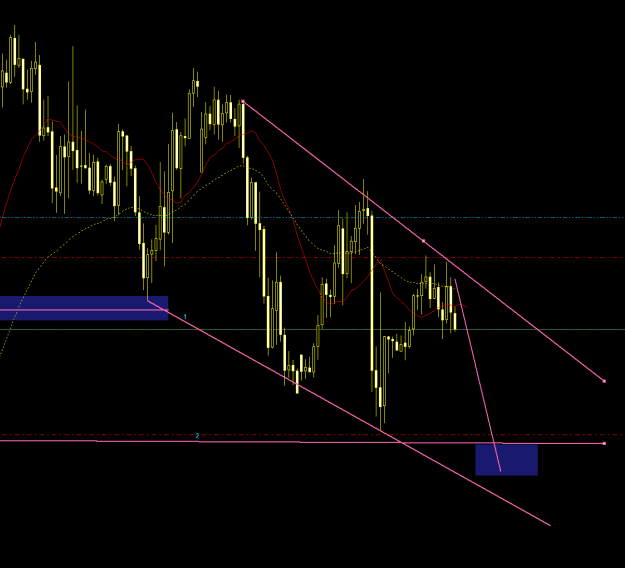
GU - Live Trade Only.
Pre FOMC is tricky as "MM" trying to get as much as possible to fill up they LQ books.
Easiest way to get those LQ is by giving false set up to take out weak hand open position.
And they do deploy an old tricks, ie taking out stop from nearby ( in both seller and buyer SL).
Brief description on chart.
My thought process pre-FOMC. Not recommendation for trade, just sharing how I see things.
Attached Image (click to enlarge)
P/s simplified version of this , you can refer to Headland chart and notes.
Mine , a bit of twisted, long version...
I'm just presenting another way of looking at the market. I think diversity is good and necessary. Detecting and recognizing patterns. GU ´s dark blue dot represents to be higher, outside the frame. I may be wrong {image}{image}
Ignored
Interesting. Am I right in thinking then that the move down to green dot, then a 'more aggressive/fast' move up to blue dot is a pattern (up to the current prevailing price) that you have seen repeat in this pairing - gbpusd, on this 1hr t/f? and if so, may I ask what is the % chance of it doing so again based on your presumably large historical sample (s?) Thanks.
Intraday swing trader @ 30min+ supp/res, & 5min+ sbr/rbs, via 1min+ set-ups
I'm just presenting another way of looking at the market. I think diversity is good and necessary. Detecting and recognizing patterns. GU ´s dark blue dot represents to be higher, outside the frame. I may be wrong {image}{image}
Ignored
Leveles are found through proportions (not accurate) but good enough to hit the right direction
{quote} Interesting. Am I right in thinking then that the move down to green dot, then a 'more aggressive/fast' move up to blue dot is a pattern up to the current prevailing price that you have seen repeat in this pairing - gbpusd, on this 1hr t/f? and if so, may I ask what is the & chance of it doing so again based on your presumably large historical sample (s?)
Ignored
First, i detect a specific micro pattern which triggers off light blue dot and then i display retracements percentages. It can happen anywhere any instrument
{quote} First, i detect a specific micro pattern which triggers off light blue dot and then i display retracements percentages. It can happen anywhere any instrument
Ignored
This pattern does not need to be at begining of movement. It can be anywhere along the section between light blue and red
{quote} First, i detect a specific micro pattern which triggers off light blue dot and then i display retracements percentages. It can happen anywhere any instrument
Ignored
Thanks. Doesn't really answer my question though. Are you saying that the move down to green dot then up to blue dot is the greater probability of future near-term price discovery based on a large empirical historical sample (s) pattern on this gbpusd pairing, on the 1hr chart? Yes or No,? and if the answer is yes then what is the % chance of this, would you mind saying? I just want to understand/be clear.
Intraday swing trader @ 30min+ supp/res, & 5min+ sbr/rbs, via 1min+ set-ups
{quote} Thanks. Doesn't really answer my question though. Are you saying that the move down to green dot then up to blue dot is the greater probability of future near-term price discovery based on a large empirical historical sample (s) pattern on this gbpusd pairing, on the 1hr chart? Yes or No,? and if the answer is yes then what is the % chance of this, would you mind saying? I just want to understand/be clear.