{quote} yes, almost everyone here thinks about where the price will go in the future and opens a position based on that. I do not.
Ignored
How do you know what almost everyone does?
I hope that everyone has his/her own idea and follows his/her own plan as many of the views are obviously wrong. Building sentiment based on other’s sentiments is obviously terribly wrong approach. So allow me to correct you - you have no chance knowing what almost everyone does.
Nevertheless your comment opens the question - Why are you here?
I know sometimes is entertaining though to see who’s right and who’s wrong
No username yet? You are on my ignore list. Fuck off and do not quote me!
{quote} How do you know what almost everyone does? I hope that everyone has his/her own idea and follows his/her own plan as many of the views are obviously wrong. Building sentiment based on other’s sentiments is obviously terribly wrong approach. So allow me to correct you - you have no chance knowing what almost everyone does. Nevertheless your comment opens the question - Why are you here? I know sometimes is entertaining though to see who’s right and who’s wrong
Ignored
after many years I just have to say that I am only on the sides of ff because I get bored sometimes. .
there is nothing new anymore.
{quote} after many years I just have to say that I am only on the sides of ff because I get bored sometimes. . there is nothing new anymore.
Ignored
There are only two possibilities mate. Either UP or DOWN. And they cannot occur simultaneously I understand that it can get boring sometimes. But I know something that I’ve experienced myself - something that can make up for the boring time. It’s called profit. Have you tried that?
No username yet? You are on my ignore list. Fuck off and do not quote me!
{quote} There are only two possibilities mate. Either UP or DOWN. And they cannot occur simultaneously I understand that it can get boring sometimes. But I know something that I’ve experienced myself - something that can make up for the boring time. It’s called profit. Have you tried that?
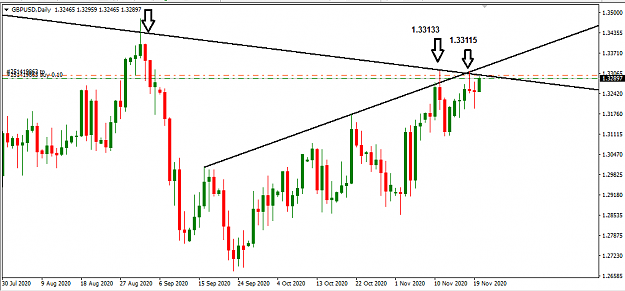
...We all know the current technical position on 4hr - weekly chart - it is unquestionably bullish and if you believe the central premise of TA that everything that is known that might affect price is discounted into the current prevailing price then it follows that the technicals have reflected the ebb and flow of the optimistic/pessimistic chances of Uk getting a trade deal with the Eu. Of late the overall bullishness in £ has reflected the overall optimism of the chances but as vm in his recent post says this could quickly correct the other way. In gbpusd of course this is only one side of the equation but for the sake of this post I won't touch on the $ / U.s side.
If the £ does fall then it will mitigate to whatever extent the effects of british exports being more expensive to the E.u and other major export markets with the tariffs imposed if we trade on WTO terms. [ I don't think Biden is in any hurry to do a deal with us - he has plenty of things on his incoming 'to do' list that will take priority, particularly if the N.I thing isn't sorted in a no-deal situation with the Eu.] Also, and to a greater or lesser extent more of the british people might stay in Uk for their hols due to hols abroad becoming more expensive as the £ will be weaker against other major currencies, so again good for Uk economy. Of course there are consequences of a weaker £ but just looking at these two in particular, who is to say that this is not a desirable outcome for the Uk in the event of a no Eu deal ?
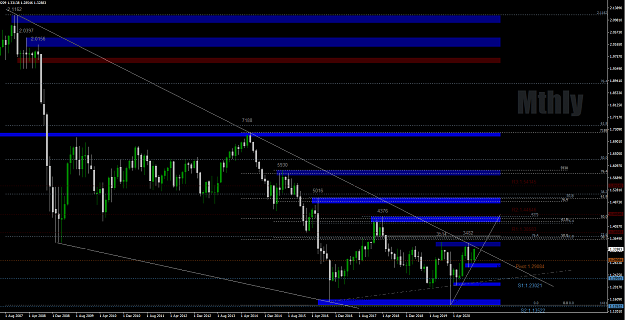
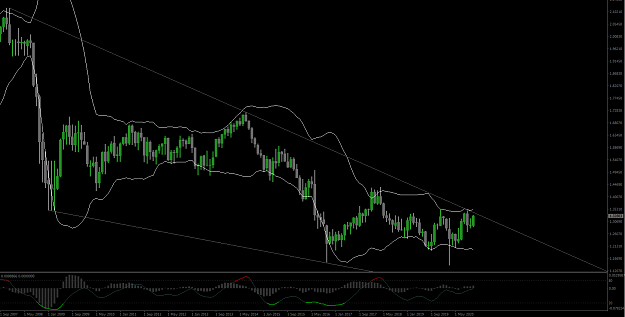
... from a technical perspective, and inline with Georginson's and others' longer term bullish view, the falling multi-year wedge type pattern on mthly suggests a break of it to the upside is more probable than not at some point. 2 xMthly charts below (2nd showing the osc div.) You can also see the pattern of regular bullish divergence between price and the oscillators. This year's current and likely 1411 lo is the lowest multi year point on the chart below.
Yrly pivot is @ 2908 so price presently trades well above that. Yrly R1 is @ 3858, Yrly S1 @ 2302.
... from a technical perspective, and inline with Georginson's and others' longer term bullish view, the falling multi-year wedge type pattern on mthly suggests a break of it to the upside is more probable than not at some point. Mthly below. You can also see the pattern of regular bullish divergence between price and the oscillators. This year's current and likely 1411 lo is the lowest multi year point on the chart below. {image}
Ignored
Mate I like your chart and this is exactly how I see it too. You can get even clearer divergence picture using RSI. And the way you did that is exactly how divergence should be analyzed. Divergence doesn’t come in play before it gets confirmed and you show exactly how it’s done.
This method of confirming a divergence almost never fails.
Good job
No username yet? You are on my ignore list. Fuck off and do not quote me!
{quote} Mate I like your chart and this is exactly how I see it too. You can get even clearer divergence picture using RSI. And the way you did that is exactly how divergence should be analyzed. Divergence doesn’t come in play before it gets confirmed and you show exactly how it’s done. This method of confirming a divergence almost never fails. Good job
Ignored
Thank you for your comment. It is a central part of my trading edge (albeit on smaller t/f's) and I look for (as part of the whole confluence based set-ups) certain repeating patterns @ potential pre-identified supp or res, and yeh crucially the pa trigger/confirmation to effect a market entry. As you rightly say it is hi in probability if used correctly and of course the higher the t/f's above the one used as entry that such repeating patterns exist on / the potential supp/res exists on - the potentially more significant a swing point it may turn out to be if of course borne out/confirmed by developing PA on the successively higher t/f's above that used for entry.
{quote} Mate I like your chart and this is exactly how I see it too. You can get even clearer divergence picture using RSI. And the way you did that is exactly how divergence should be analyzed. Divergence doesn’t come in play before it gets confirmed and you show exactly how it’s done. This method of confirming a divergence almost never fails. Good job
Ignored
"Start with 1000$. Increase by 3% every day. After one year 2 213 314$"
{quote} Hey buddy what’s up?! Long time no see?... I am for the most of the time on the news section as I think here is too much useless confrontation. The price goes where the price wants to go anyway no matter how much we argue How’s going buddy?
Ignored
I’m all good buddy. It’s been a long minute I must agree .. Hope you well.. Asper the confrontations, I’d say it’s getting better yerrr.. A few weeks ago was something else..
That’s fact! Price goes where it wants regardless of our arguments.. I am with you on the bull side till 1.38 before any meaningful retrace..
New week ahead of us, let’s see how it goes
StaySafe bro