Cable Analysis
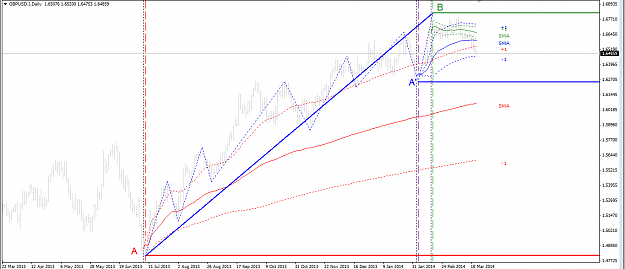
Based on KG_Wave, cable is still on a wave up as shown by the blue trendline starting low at the point A and continue to move higher till it reach the high on point B. From high at point B, price tend to move down, and we assume this down move from point B as a retrace movement from wave up A-B.
based on point A as starting point I use Red BolingerBands o see whether price move approaching or keep moving away thru the low at point A. As shown by Red Boinger Band price still above the Middle Band of Red Bolilinger Bands it means price still can go further north to get away from point A.
Based on sub main wave up A' as a starting point, I use Blue Bollinger Bands to see whether price approaching or keep moving away to point A', as seen on the chart, price is now right at the Lower Bands of my Blue Bolinger Bands, and this is the critical point to decide that price is keep moving away from A' or go approaching point A'.
Next starting point of my analysis is on high at point B, similiar things with point A, I use the Forest Green bolinger band to see if price go approaching or keep moving away from the point B. Now price is below the Lower Band of my Forest Green Bolinger Band, it means price is currently go further south away from hight at point B.
Where will price move after this time? we dont know, but I have the journey maps of Cable to gather informations and bulid some strateigies.
regards
-alto-
Attached Image (click to enlarge)
Based on KG_Wave, cable is still on a wave up as shown by the blue trendline starting low at the point A and continue to move higher till it reach the high on point B. From high at point B, price tend to move down, and we assume this down move from point B as a retrace movement from wave up A-B.
based on point A as starting point I use Red BolingerBands o see whether price move approaching or keep moving away thru the low at point A. As shown by Red Boinger Band price still above the Middle Band of Red Bolilinger Bands it means price still can go further north to get away from point A.
Based on sub main wave up A' as a starting point, I use Blue Bollinger Bands to see whether price approaching or keep moving away to point A', as seen on the chart, price is now right at the Lower Bands of my Blue Bolinger Bands, and this is the critical point to decide that price is keep moving away from A' or go approaching point A'.
Next starting point of my analysis is on high at point B, similiar things with point A, I use the Forest Green bolinger band to see if price go approaching or keep moving away from the point B. Now price is below the Lower Band of my Forest Green Bolinger Band, it means price is currently go further south away from hight at point B.
Where will price move after this time? we dont know, but I have the journey maps of Cable to gather informations and bulid some strateigies.
regards
-alto-
Simplicity Is The Ultimate Sophistication ~LDV~