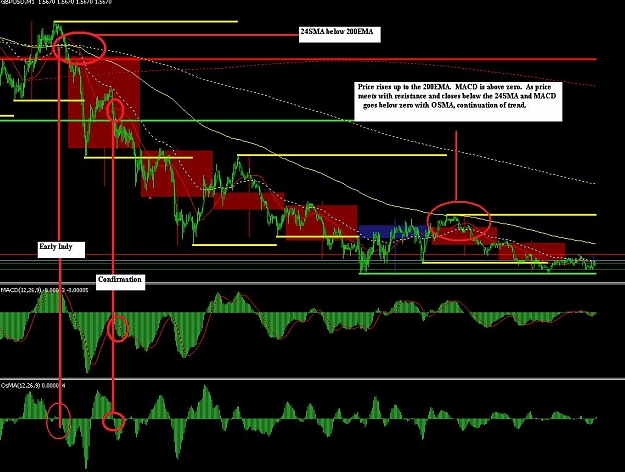
The red lines that you see on my charts are a 24SMA, the Yellow is the 200EMA.
If we are in a situation where price is Below the 200EMA, and crosses below the 24SMA, I take trigger, and will use price points and other time frames for support ranges. For now...watch the 1m and 5m chart. As price retraces back to the 200EMA, watch for resistance, if it again drops below the 24sma and closes candle, this is what I use for trade triggers, always eyeballing the MACD on both.
As I am a part time trader, I try to only hold trade when I have full on confirmation or will only take trade for when I can make sure that I will close. As my price points are dictated by Moving Averages, it can be difficult to set an accurate tp...that is speculation and has so many times been the death of my account.
Last night on retrace back to top, I had take profit set to 5 below top and by chance happened to still be awake when we came to that zone and ended up just auto triggering.
I like safety ranges. They play much better. Plus, even if I am wrong on an entry, I know I will still get out. Counter trends...not so much.
Hope this helps.
For now, with weak volume, I will sit tight. Profit locked in and no open trades. I will wait for a retrace to the 200EMA on the 5m chart and wait for direction from there.
Money Can't Buy Happiness. Poverty Can't Buy SHIT! You Choose!