• Home
  • Forums
  • Trades
  • News
  • Calendar
  • Market
  • Brokers
  • Login
  • Join
  • User/Email: Password:
  • 5:20am
Menu
  • Forums
  • Trades
  • News
  • Calendar
  • Market
  • Brokers
  • Login
  • Join
  • 5:20am
Sister Sites
  • Metals Mine
  • Energy EXCH
  • Crypto Craft

Options

Bookmark Thread

First Page First Unread Last Page Last Post

Print Thread

Similar Threads

Elliott Wave Theory 7 replies

The Fundamental Error of Elliott Wave Theory 36 replies

A more modern Elliott wave theory book? 2 replies

elliott wave theory 1 reply

Wave Theory 1 reply

  • Rookie Talk
  • /
  • Reply to Thread
  • Subscribe
  • 15
Attachments: The Basics of Elliott Wave Theory
Exit Attachments
Tags: The Basics of Elliott Wave Theory
Cancel

The Basics of Elliott Wave Theory

  • Last Post
  •  
  • 1 234Page 56 7
  • 1 4Page 56 7
  •  
  • Post #81
  • Quote
  • Mar 17, 2007 9:50am Mar 17, 2007 9:50am
  •  smartrends
  • | Joined Mar 2007 | Status: Member | 5 Posts
Thank you for a good information on Elliott Waves.
 
 
  • Post #82
  • Quote
  • Mar 20, 2007 7:03pm Mar 20, 2007 7:03pm
  •  itme
  • Joined Aug 2005 | Status: Member | 2,217 Posts
Futures magazine is featuring a streaming video lesson, Five Keys to Spotting Trade Setups, from EWI’s own Futures Junctures editor, Jeffrey Kennedy.
In this lesson, Jeffrey gives you a simple checklist of how to identify high probability trade setups.
Futures magazine has made this streaming video available to you, at no cost. They are also offering a complimentary subscription to Futures magazine for all Club EWI members. Their magazine is always a great read and we encourage you to take them up on their special offer.
You can view Five Keys to Spotting Trade Setups and start your complimentary subscription by visiting:
http://www.elliottwave.com/wave/futuresmag307

The occasional snapping finger is not enough to wake you from the evil Svengali's "Media Headline Hypnosis." To escape the clutches of the zombie trance, you must habitually compare what you hear from the media with what you see in charts of stock market price activity. If you do this within the framework of Elliott Wave analysis, you'll gradually begin to see the effects of social mood on both markets and minds. You will begin to ignore the headlines, and you'll develop an edge -- because you will know the following:

a) Markets unfold in patterns
b) Where prices are within that pattern
c) What to expect next
d) Exactly what can and cannot happen for your expectation to remain valid, and,
e) Social mood, not headlines, is what moves markets

Now you have a recent memory of what a bear market impulse wave feels like, and what kind of headlines it produces. In case you missed it, we published a rare, free Special Short Term Update last Tuesday, March 13 so you can see what an impulse wave looks like on a real-time chart. You can see it here. Since then, Steve's forecasts have been spot on, and the Dow has traced out a classic Elliott corrective pattern, thus the somnambulistic press. But this corrective wave too, will end.
 
 
  • Post #83
  • Quote
  • Mar 20, 2007 8:34pm Mar 20, 2007 8:34pm
  •  itme
  • Joined Aug 2005 | Status: Member | 2,217 Posts
Elliott Waves in Real Estate: The Subprime Mortgage Meltdown

http://www.elliottwave.com/education/


Inserted Video


More on Real Estate ...

A thorough, up-to-date outlook on real estate:


EWI's MarketWatch: Houses Built on Sand
EWI's MarketWatch: Waking Up to a Meltdown
EWI's MarketWatch: "Real Estate for Dummies"
EWI's MarketWatch: "Be Scared--I Sell Real Estate in Manhattan"
 
 
  • Post #84
  • Quote
  • Mar 21, 2007 2:00am Mar 21, 2007 2:00am
  •  itme
  • Joined Aug 2005 | Status: Member | 2,217 Posts
Watch this video from last Friday's (Mar. 16) Daily Futures Junctures, where EWI editor Jeffrey Kennedy analyzes Elliott wave patterns in three of his favorite markets. Also, don’t miss Jeffrey's latest long-term commodity market forecasts in the just-published, March issue of EWI's Monthly Futures Junctures. Click here to view the video.
 
 
  • Post #85
  • Quote
  • Mar 21, 2007 2:10am Mar 21, 2007 2:10am
  •  itme
  • Joined Aug 2005 | Status: Member | 2,217 Posts
3/16/2007 5:11:06 PM
By Vadim Pokhlebkin

One thing you may have noticed about forex markets' fundamental indicators is that their meaning can change like the wind.

Take interest rates. When the Federal Reserve started raising them in 2004, analysts said "buy the U.S. dollar," because higher interest rates are dollar-bullish. But after the Fed raised rates 17 times in a row, analysts said wait a minute, won't higher rates hurt the economy? In turn they said "Sell the dollar."

The Fed hasn't touched the rates for eight months now, keeping analysts guessing about the way the wind may blow next. And this week's U.S. economic numbers sure haven't made things any easier. The PPI and CPI numbers came in higher than expected, which means that inflation is picking up. Before, this would be "good news" for the USD – because to fight inflation, the Fed must raise interest rates. Now, it's no good news at all. If the Fed raises rates, it will make borrowing more expensive – and that's the last thing the U.S. economy needs right now, in the middle of a "mortgage meltdown."

Could all this confusion be the reason why today (Mar. 16), the USD dropped to its lowest point against the euro this year?

Of course, technical market indicators aren't foolproof, either; no market-forecasting method is. But at least with technicals you don’t have to interpret the signals based on the overall economic context.

In Elliott wave analysis, for example, if a pattern you see in the chart satisfies Elliott's rules and guidelines, there is nothing left to interpret. Take a look at this intraday chart our Currency Specialty Service posted on Friday, for example:

http://www.elliottwave.com/images/fo...03-16-07-1.gif

As you can see, we believe the EUR/USD rally late on Thursday was a wave iii. What's more, it appears complete. According to Elliott, what should come next is a correction in wave iv – and then further rally in wave v, to complete the sequence.

As for the PPI, CPI and the U.S. mortgage crisis, well…let others try and interpret what it means for this market. We've got all the evidence we need.
 
 
  • Post #86
  • Quote
  • Mar 21, 2007 10:58pm Mar 21, 2007 10:58pm
  •  SunTrader
  • Joined Mar 2006 | Status: Trade the reaction not the news! | 10,419 Posts
If the Dow is in a corrective wave up from a down impulse (?), it is doing a damn good job of disguising itself.

I would expect thursday to have some kind of a pullback after such a big move today as well as the fact that it has retraced 61.8% of the down move from the high one month ago.

But will have to see whether or not the party is over.

BTW I have a sister who does sell real estate in Manhattan with one of the biggest firms. I sent her the letter EWI got and her opinion is that although the market is priced ridiculously (has been for a long time though) and has slowed dramatically, the writer doesn't sound like someone in the biz to her. Whatever.

Also I can't help but notice that each of those EWI newsletters have ordering information. Ca-ching. I guess it is a fixation of mine.

Keep 'em coming.
 
 
  • Post #87
  • Quote
  • Mar 22, 2007 12:16am Mar 22, 2007 12:16am
  •  itme
  • Joined Aug 2005 | Status: Member | 2,217 Posts
Quoting SunTrader
Disliked
If the Dow is in a corrective wave up from a down impulse (?), it is doing a damn good job of disguising itself.

I would expect thursday to have some kind of a pullback after such a big move today as well as the fact that it has retraced 61.8% of the down move from the high one month ago.

But will have to see whether or not the party is over.

BTW I have a sister who does sell real estate in Manhattan with one of the biggest firms. I sent her the letter EWI got and her opinion is that although the market is priced ridiculously (has been for a long time though) and has slowed dramatically, the writer doesn't sound like someone in the biz to her. Whatever.

Also I can't help but notice that each of those EWI newsletters have ordering information. Ca-ching. I guess it is a fixation of mine.

Keep 'em coming.
Ignored
some good points, SunTrader. I doubt the writer is a real estate professional. Elliott Wave theory is just a theory, and a very strange one at that. Elliotticians dare to analyse all markets, purely technically. So I personally think that Ellliott Wave theory should be, if possible, combined with as many other market forecasting tools as possible to arrive at a reinforcing constellation of independent factors favoring the market prediction. But it is a good one, as models go, if it is used skillfully and conservatively.
 
 
  • Post #88
  • Quote
  • Edited 9:11am Mar 23, 2007 12:50am | Edited 9:11am
  •  itme
  • Joined Aug 2005 | Status: Member | 2,217 Posts
By Vadim Pokhlebkin

One of the most frequent questions readers ask us is: "Does Elliott Wave Principle apply to individual stocks?"

Individual stocks are by far the most common type of security held by investors, so a strong interest is understandable. But to answer this question, you have to understand how the Wave Principle works and accept its two basic premises.

First, the Principle assumes that financial markets are emotional, which defies the conventional assumption that financial markets are rational. (If you want proof, watch the stock market for a week and count the number of times when stocks rally on "bad news" and fall when the news is "good.")

Second, the Wave Principle says markets are patterned, which confronts Wall Street's famous notion that they are random. The Principle describes thirteen patterns that occur over and over again, in all timeframes. It's those recurring patterns that make markets predictable.

But it goes deeper than that. What those wave patterns in charts represent are collective emotions of market players. For reasons not entirely understood, investors' mass emotions swing in patterns – Elliott wave patterns. So when you're counting waves in your favorite stock, you're really counting swings in collective optimism and pessimism of people trading it.

What's more, the bigger the market you're dealing with, the more emotional it will be. That makes sense: In markets with less participation (like single stocks), investors' rational decisions may at times prevail and override the herding impulses common to larger markets (like stock indexes.) That's why the answer to the question "Does the Wave Principle apply to individual stocks?" is always – yes, but with a few caveats.

The main caveat is the size of investor participation in a particular stock. Penny stocks don't have enough players to accurately reflect a true mass psychology – so, understandably, penny stocks will rarely trace out consistent wave patterns. Large caps, on the other hand (anything with a market cap of over $10 billion) are a whole different ball game. Mid-caps often exhibit steady, tradable wave patterns, too.

But even with large and mid-caps, investor participation may not be big enough to overpower outside influences – e.g., what the competition is doing, what foreigners are doing with similar products, government policy, whether the CEO is having personal problems, etc. There are lots of specific reasons – besides investors' collective emotions – why a single stock may be going up or down on a particular day, week or month. That's why a single stock won't always trace out patterns that are perfectly reflective of the Wave Principle.

How do you apply Elliott to an individual stock, then? A classic joke with the punch line "very carefully" comes to mind – but there is a better answer.

Bob Prechter, EWI's president and a recognized Elliott wave authority, gives this simple advice: Avoid trying to analyze each issue on an Elliott basis unless a clear, unmistakable wave pattern unfolds before your eyes and commands attention. Decisive action is best taken only then.

EWI's stock-picking service, Prime Stocks Flash, picks from stock pools of all sizes. Prime Stocks Flash's latest recommendation, for example, is from the large-cap category: KLA-Tencor Corp (KLAC). But the pick on March 2nd was a mid-cap: Silver Standard Resources (SSRI).
Here is the complete list of currently open Prime Stocks Flash recommendations:
Ford Cameco Titanium Metals Merrill Lynch EarthLink JPMorgan Chase Bank of America Goldman Sachs KLA-Tencor Corp. Intel Best Buy United Technologies McGraw-Hill Silver Standard Resources Google Hecla Mining Microsoft Alliance Data Systems Proctor & Gamble Apple United Health Group Everest Reinsurance Cisco Systems QUALCOMM Procter & Gamble Network Appliance Technology Sector SPDR XLK Semiconductor HOLDRs SMH. Burlington Northern Santa Fe Corp.
 
 
  • Post #89
  • Quote
  • Mar 23, 2007 7:40pm Mar 23, 2007 7:40pm
  •  itme
  • Joined Aug 2005 | Status: Member | 2,217 Posts
To speak to the uninformed naysayers who think that Elliott Wave Theory is nothing more than superstition or is purely subjective, a "figment of the imagination" with no predictive value, I would like to share that Man Financial, a multi-billion dollar multinational financial company, has a partner relationship with Elliott Wave International, to encourage their commodities, stock and Forex clients to explore the advisory services of that organisation. I doubt that a company with the stature of Man / Refco would partner with a purely flaky outfit seeped in baloney and illusion, when they had a choice to partner with literally thousands of other market advisory services. Note that FXCM, DailyFX, Trading Post Financial Services, Phincorp and ForexNews are also heavily oriented towards Elliott Wave Analysis in their education, in house analysis, and advisory partnerships.:

http://www.refco.com/images/divider.gif
http://www.refco.com/images/map.gif
As an experienced and established participant in the Foreign Exchange market, Man FX Clear LLC distinguishes itself in two ways:

  1. By offering multiple avenues for investors and traders to benefit from identified opportunities; and
  2. By focusing on client order flow rather than taking directional positions for its own account.
  3. In addition, Man FX Clear LLC has 24-hour trading facility coverage of all major and most minor currencies, including spot, forwards, options, swaps, EFP's and custom derivative overlays.

All Man FX Clear LLC foreign exchange facilities are enhanced by our systems and infrastructure resources, which include Web-based access to live pricing, reporting and margin monitoring.

  1. Man FX Clear is one of the most advanced on-line prime brokerage trading platforms integrating cutting-edge electronic technology with Man FX Clear LLC's advanced solutions in clearing and credit support.

This is what is written on the "Education" page of their website:

FUTURES AND OPTIONS EDUCATION


We offer professional derivatives training programs that are predicated on financial theory; yet our emphasis is on the application and strategy of how to implement derivatives to manage risk through portfolio modification. Participants in our derivatives programs have come to us from more than 60 countries, and represent a variety of the world’s largest institutions, including more than a dozen central banks, supra-national organizations, securities companies, commercial banks, hedge-funds, corporations, insurance companies, government agencies and financial exchanges. Three Day Option Workshop
Five Day Futures and Options Seminar
Three Week Futures and Options Seminar
Customized programs are available upon request
Commodities

Commodities Central is where you’ll learn more about the physical commodities markets and their unique fundamentals. From silver to soybeans, find out what drives these markets and how they are traded. You’ll also find links to North American exchanges offering trading in physical commodities and a list of contracts available to trade. NFA Educational Materials


The following materials have been provided by the National Futures Association (NFA) to help you make informed financial decisions. These publications are the property of National Futures Association. Buying Options on Futures Contracts: A Guide to Uses and Risks (27 pages)
A Guide to Understanding Opportunities and Risks in Futures Trading (50 pages)
Volatility Futures


Volatility futures provide investors the ability to act on their opinion of stock market volatility direction and magnitude. Stock market volatility became a tradable part of the investment landscape in March 2004, with the introduction of futures on the CBOE Volatility Index, or VIX, at the CBOE Futures Exchange. The CBOE developed the VIX in 1993, and it measures market expectations of near-term volatility conveyed by stock index option prices.

  1. VIXFutures White Paper (PDF)
  2. VIX Historical Data
  3. VIX Microsite

Additional Material


What You Should Know Before You Trade from the CFTC
Economic Purposes of Commodity Futures Trading, from the CFTC
The CFTC Glossary: A Guide to the Language of the Futures Industry, from the CFTC
Introduction to the Futures and Options Markets, from the Institute for Financial Markets
The CBOT Mini-Sized Dow: Trading the Market's Measure, from the CBOT

Elliott Wave International
http://www.refco.com/images/divider.gif
http://www.refco.com/images/elliotWave.gif Refco invites you to receive a free 14-day trial of Elliott Wave International's premium market analysis featuring 24-hour intraday, daily and long-term coverage of all major markets worldwide... http://www.refco.com/images/more.gif
http://www.refco.com/resources/rs.education.asp


  • Post #90
  • Quote
  • Mar 28, 2007 11:47am Mar 28, 2007 11:47am
  •  itme
  • Joined Aug 2005 | Status: Member | 2,217 Posts
3/22/2007 10:51:33 PM
By Morgan Lee

The closest I’ve ever come to witnessing a stampede is through watching a Western, or maybe seeing a few daredevils get flattened in the running of the bulls in Spain on late-night television.

Yet even then, as removed as I was from the real action, the visual of a herd thundering on in one direction was impressive. At moments like that, animals are clearly of one mind, and it takes a near superhuman effort to stop them, not to mention to get them to change direction.

Interestingly, cattle aren’t the only animals that herd – so do humans. Except we express our herding impulses via stampedes of a different kind: through our collective tastes, fashion, political choices, etc., but also – most importantly for our purposes – through our investment decisions. Once mass psychology gets us humans going in one direction, you need the Superman to fly around the earth and change its rotation before we stop and listen.

Elliotticians attribute human herding tendencies to a phenomenon called social mood. Few things reflect changes in its direction as well as prices of financial assets. Doubt it? Look at the Crude oil market.

In August of last year, as traders turned bearish on Crude, it started to slide from around $80 to below $60 a barrel. The sell-off continued despite reports of increased energy usage from China and India, instability in the Middle East (the source of much of the world’s oil) and OPEC's vows not to let oil fall below $60. The news was bullish, but oil kept sliding lower, until bearish-minded investors drove prices to the January low of almost $50 a barrel.

In February, Crude bounced back. But human herding tendencies are strong, and investors' collective mindset can be slow to change; the February bounce gave way to another push lower in Crude.

“Nobody seems to want oil today because refinery utilization is so low,” explained the slide to Bloomberg.com one commodities trader – and he was right…but only half-right. The reason why nobody wants oil today is not because of "refinery utilization," from Elliott wave point of view. It’s because the bear market mentality that has pushed prices lower since August still has its clutches on the mass psychology of oil traders.

It's exactly this kind of oblivious behavior that gets many investors in trouble at markets' turning points. Crude jumped almost $2 on Thursday (March 22) – so somebody must want it, even if the overall market doesn't. What's more, we at Elliott Wave International think this jump could be the start of something big. Take a look at this chart:

http://www.elliottwave.com/images/fu...%203-22-07.gif

As you can see, our Energy Specialty Service is counting the price action in Crude from the January low as a "one-two," with wave (ii) spanning the first two weeks of March. And as you may know from studying wave analysis, the psychology of second waves can be very deceptive. That's when investors feel that the previous trend (in this case, the bear one) has returned. Which helps explain the "nobody-wants-oil" attitude, doesn't it? Ironically, this market could be on a verge of wave 3, the most swift and powerful wave in the 1-2-3-4-5 Elliott wave sequence.

Clearly, there could be an opportunity developing in Crude. Wave three, if it comes, will likely be the point where the crude oil "herd" finally changes its tune to bullish – but it may be too late to do anything about it then. Herds, because of how inert they are, generally come late to every party...
 
 
  • Post #91
  • Quote
  • Mar 28, 2007 12:18pm Mar 28, 2007 12:18pm
  •  itme
  • Joined Aug 2005 | Status: Member | 2,217 Posts
3/26/2007 7:11:52 PM
By David Moore

In one of this winter's most impressive – but overlooked – moves, CBOT Corn prices traced out a huge five-wave pattern that's quite clearly an impulse. The May contract's sixth-month rally handily cleared almost ten years of previous highs, before stalling just under $4.50 per bushel.

http://www.elliottwave.com/images/fu...%203-26-07.gif

Yet the current market for Corn has much more to offer than a history lesson. If you weren't watching when prices moved 70% in sixth months, it looks like you have a second chance to see something quite similar unfold shortly – and in real time.

That certainly doesn't mean you should neglect your due diligence. In fact, to understand why this next move is likely, and the key ways in which it will differ from the earlier impulse, you have to look beyond the obvious aspects of the recent rally. Do that, and you'll get more than a clear view of the opportunity our Daily Futures Junctures deems good enough to have featured twice last week.

You'll also confront an implication of the Wave Principle that I personally found very difficult to accept when I started out with Elliott: That a top isn't always "the" top, and that the "end" of a rally isn't always the end of a wave pattern.

In other words, the impulse that's so easy to discern in Corn actually came to a close before the market's prices topped out at the end of February. And the down-up swing that put in the high was actually a pair of three-wave moves – the start of a new, corrective wave pattern, called an "expanded flat." And indeed, what distinguishes this pattern from any other correction is that it always creates a new price extreme – top or bottom – that goes beyond the end of the previous impulse wave.

It may not be clear why this counterintuitive way of labeling some extremes is so critical to successfully trading with the Wave Principle – it wasn't clear to me at first, either. Yet there's nothing like watching a few of these patterns unfold in real time to understand just how much of a difference this distinction makes.

Recognizing that a new top or bottom is part of an expanded flat is often the difference between being on the ball when the trend resumes – or being under it for days or even months, depending on the degree of the pattern.
But like I said, you need to see this in real time to get a firm grip on why it matters. And you have a great chance to do that right now. Having a firm handle on price action around the recent top in Corn has put us in position to recognize the opportunity that's pending now. Futures Junctures editor Jeffrey Kennedy's latest Weekly Wrap-Up video (Mar. 23) explains the current wave count in Corn and why another huge impulse is likely due this week.

What's more, several external indicators corroborate the Elliott picture remarkably well. Daily Sentiment Index (DSI) and Commitment of Traders data (COT) both register multi-year extremes that are bound to give way soon. Momentum studies suggest Corn prices are set to turn.

The Mar. 22 Daily Futures Junctures compares these technical studies side-by-side with our wave analysis for Corn. The Mar. 23 DFJ includes Jeffrey's focused look at the expanded flat in his Weekly Wrap-up Video. To see both now, subscribe to Futures Junctures Service risk-free.
 
 
  • Post #92
  • Quote
  • Mar 28, 2007 1:28pm Mar 28, 2007 1:28pm
  •  itme
  • Joined Aug 2005 | Status: Member | 2,217 Posts
Do you know how to tell a regular flat correction from an expanded one? While similar at first glance, they have different implications for the correction's ending price target. Watch this free clip from last Friday's (Mar. 23) Daily Futures Junctures Weekly Wrap-Up video where editor Jeffrey Kennedy analyzes an expanded flat correction in Pork Bellies.

Every Friday in his Weekly Wrap-Up, EWI's Chief Commodities Analyst Jeffrey Kennedy tells you about the hottest trends in commodity markets.

Watch this free clip from last Friday's (March 23) Daily Futures Junctures Weekly Wrap-Up, where Jeffrey analyzes Elliott wave patterns in Pork Bellies.

http://www.elliottwave.com/features/...ideo=3_26_2007
 
 
  • Post #93
  • Quote
  • Mar 28, 2007 11:02pm Mar 28, 2007 11:02pm
  •  itme
  • Joined Aug 2005 | Status: Member | 2,217 Posts
‘This Wave C is Going to Be Special’

Those are the words that Bob Prechter uses to describe the impending bite of the bear market – which caught so many in the financial world off guard when it reared its head on February 27 – in the latest Elliott Wave Theorist, released March 23. The March Theorist describes why the next leg down will be historic and why so few people are prepared for both the dangers and opportunities that will rise from it.

Let's see if Mr Prechter is right. If so, it might validate his style of interpreting Elliott Wave theory.
 
 
  • Post #94
  • Quote
  • Mar 29, 2007 2:08am Mar 29, 2007 2:08am
  •  itme
  • Joined Aug 2005 | Status: Member | 2,217 Posts
3/28/2007 5:03:51 PM
by Alan Hall

It was late Friday afternoon in 1977, about this time of year in South Georgia. I was working in the fertilizer plant my grandfather started in 1898. I was almost outta there for the weekend when the soybean seed truck pulled up. Ten tons of beans later, the 400 fifty-pound bags were neatly stacked in the seed house, and I was tired.
Soybeans cost $6.00 a bag back then. They cost less than eight dollars a bag now, so the farmers are still sucking hind tit.
Believe me, moving actual bags of soybeans for 10 weeks will tell you nothing about their future price. And, sometimes, neither does watching a 10-week moving average of soybean prices. The chart below, from Tuesday's (Mar. 27) Daily Futures Junctures, shows what I mean.

http://www.elliottwave.com/images/fu...s%20weekly.gif

The 10-week moving average of the Daily Sentiment Index is shown in red at the bottom of this weekly soybeans chart. The percentage of bullish traders is shown on the scale at the right, and as you can see, the peaks in bullishness seem to correlate pretty well with the peaks in soybean prices.
But take a closer look at the price peak in 2004. You will notice that the DSI shows a double peak that precedes the final peak in bean prices. So if you were using the DSI as your primary indicator in late 2003, you would have seen the percentage of bulls move to its highest level in at least two years, and you would probably assume the top was in. You would have missed a 25% rally. That lesson could have been expensive had you shorted soybean futures at the first peak in the DSI.
You need to use other indicators in tandem with the DSI to increase your chances of correctly anticipating price moves. For instance, Mike Boysen's full analysis of the soybean market in the March 27 Daily Futures Junctures shows weekly, daily and 30-min. charts, each with a Relative Strength Indicator, a MACD indicator, and, most importantly, with the Elliott wave labeling. With this additional information, the picture of what's next for soybeans becomes much clearer, and trading strategy become easier to plan and execute.
 
 
  • Post #95
  • Quote
  • Mar 29, 2007 2:22am Mar 29, 2007 2:22am
  •  itme
  • Joined Aug 2005 | Status: Member | 2,217 Posts
MarketWatch: Shorting The Greenspan Put
3/26/2007 4:58:02 PM
The stock markets ended mixed today, Monday March 26, 2007
by Alan Hall
At least seven historically massive, liquidity-driven bubbles have reached a dangerous intersection in the spiraling natural growth pattern of the Fibonacci sequence. Stocks, real estate, credit, government debt, consumer debt, the U.S. trade deficit, and even foreign investor's appetite for the U.S. dollar -- are all ensuring The Plunge Protection Team has its work cut out for it.
Some of the most powerful predictive tools afforded by the Wave principle, when used correctly, are Fibonacci relationships between, 1) price moves and time durations within and between waves. When several of these ratios point toward the same future date or price level, odds go up that you've found a turning point within and between waves and 2) On February 21, a special Elliott Wave Theorist Interim reported that a time window for the wave b top, February 20-28, was indicated by two Fibonacci time relationships, one price relationship, and two diagonal triangles in the Dow and S&P that had, "converged to indicate that the Dow is within hours of peaking in wave b."
That forecast was based entirely on Elliott wave technical analysis of the markets.
The latest Theorist (March 23) describes how 14 major indexes topped within that same time window. It also describes the violence of the reversal, revealed in the highest advance/decline ratio of S&P stocks ever recorded. Wave b was unusually complex, as nine major averages each took one of three different shapes of Elliott wave corrections. This complexity, combined with the "all the same market" distortions of the liquidity bubble, has made analysis difficult. But as you can see, it was not impossible.
After years of cheerleading for the asset mania, some fundamental analysts finally are beginning to see the fundamental problems. Morgan Stanley's Chief Economist Stephen Roach has turned bearish again. In his latest commentary, "The Great Unraveling," he says, "From bubble to bubble, it’s a painfully familiar saga. First equities, now housing. First denial, then grudging acceptance. It's the pattern and its repetitive character that is so striking." (Emphasis added)
The repetitive pattern is more visible now. Even consumer newsletters are warning about the bubble economy. But, outspoken as he is, Roach is still a mainstream economist, and he still has faith the Fed can prevent calamity: "Ultimately , it is up to Ben Bernanke -- and whether he has both the wisdom and the courage to break the daisy chain of the "Greenspan put." If he doesn't, this liquidity-driven era of excesses and imbalances could well go down in history as a huge failure for modern-day central banking."
The "Greenspan Put" supposedly serves in place of buying put options to protect your portfolio. It is an expression of faith in the Federal Reserve System's ability to prevent market declines. It stands to reason that to short the Greenspan Put is to be responsible for your self. It means not counting on the omnipotence of the Fed… the same Fed that in 2000-2002 oversaw the largest general market decline since the Great Depression.
It looks more likely by the day that Greenspan, and by extension the Fed, will be cast as the villains in this play. Roach sums up his Greenspan critique with, "I fear history will not judge the Maestro's legacy kindly."

The truth is you can't depend on the government that helped create this problem to protect you from the consequences. If you want more information about strategies for taking care of yourself, read Conquer the Crash, then visit the free updates page at http://www.elliotwave.com/conquerthecrash/
 
 
  • Post #96
  • Quote
  • Apr 3, 2007 2:46am Apr 3, 2007 2:46am
  •  itme
  • Joined Aug 2005 | Status: Member | 2,217 Posts
Watch this free, full-length video from last Friday's (Mar. 30) Weekly Wrap-Up, where Daily Futures Junctures editor Jeffrey Kennedy presents an excellent Elliott wave lesson using the Coffee market as an example.
NOTE: Coffee is just one of the 18 commodity markets you will find in the March 30 Daily Futures Junctures.
 
 
  • Post #97
  • Quote
  • Apr 5, 2007 2:51pm Apr 5, 2007 2:51pm
  •  itme
  • Joined Aug 2005 | Status: Member | 2,217 Posts
4/5/2007 10:59:21 AM
By Vadim Pokhebkin

If you were surprised by the euro's strong rally on Thursday morning (April 5), you weren't alone.

The EUR/USD started to rally early in Thursday's overnight session – and at around 9 AM Eastern, it really took off. As to why…well, about the only piece of economic news that "fit" with such a sharp drop in the USD was a slight rise in the U.S. unemployment announced Thursday morning – but honestly, it was too small to send the EUR/USD to a 2-year high. So what did it?

From an Elliott wave perspective, the answer is always the same: market sentiment. As you know, this week the EUR/USD has only gone sideways, indicating traders' hesitation about the trend. What's more, if you step back and take a look at a daily chart, you'll see that since mid-March or so, a massive-looking triangle has been forming in the EUR/USD. Triangles always indicate a temporary lack of conviction by market players. But when that conviction returns, triangles resolve in sharp, violent moves – a fitting description of Thursday's rally, wouldn't you say?

EWI's Currency Specialty Service has been tracking this triangle for a while. It's important to mention here that triangles usually resolve in the direction of the previous trend. Since the start of the year, the EUR/USD has only gone up, so the logical resolution for the triangle was also upward. Our Currency Specialty Service warned about this possibility in an intraday update on Wednesday (April 4):

09:47 ET/13:47 GMT
[EURUSD] Last Price: 1.3356 [Sideways, then higher] Key Levels: 1.3319 and 1.3400. The rise from 1.3339 looks corrective so far, so EUR$ might dip to a new low. But barring a break of 1.3319 we're favoring the upside, a thrust above 1.3411.

http://www.elliottwave.com/images/fo...o%204-5-07.gif

That "thrust above 1.3411" came on Thursday morning. Some analysts blamed the spike on "speculation the European Central Bank will raise interest rates while the Federal Reserve will hold borrowing costs steady" (Bloomberg). Notice the word "speculation." It’s this very speculation that moves the currency markets. Speculation is all about hunches, feelings and emotions – in short, about human psychology. After all, forex markets only move because forex traders move them.

That’s why to succeed, you want to anticipate traders’ collective mood swings. And we don’t know of any other analysis methods that help you do it better than Elliott wave.
 
 
  • Post #98
  • Quote
  • Apr 5, 2007 3:32pm Apr 5, 2007 3:32pm
  •  itme
  • Joined Aug 2005 | Status: Member | 2,217 Posts
4/4/2007 3:04:49 PM
By Morgan Lee

Anyone who has followed Soybeans futures for the past month knows that this market has been acting like a Mexican jumping bean.

Since plummeting from a late-February high of almost 810 to 739 1/2 by early March, this futures market has developed a seemingly schizophrenic personality – bouncing daily between highs and lows, while slowly climbing its way back up. Trying to diagnose the reasons why, analysts have been citing everything from planting reports, to a collapse in the corn markets, to the fact that farmers might have actually planted more soybeans than first reported.

But before you develop multiple personalities in trying to figure it all out, step back, take a deep breath, and look at what Daily Futures Junctures editor Jeffrey Kennedy has to say about this market. Jeffrey has held a bearish forecast on Soybeans for some time. What's more, he thinks that Elliott wave patterns continue to point lower in this market despite its climb to 788 on April 2.
Why? Three key reasons, all of which Jeffrey makes clear in his Tuesday (April 3) Daily Futures Junctures – and they have nothing to do with crop reports.

  1. First, look at the chart below. While Soybeans has seemingly jumped all over the place, the advance is full of overlapping waves that are contained by parallel lines. Both are key characteristics of corrective wave structures. And, as you can see by Jeffrey’s wave count, the slide from February’s high was the start of an A-B-C correction. Since there has been no impulsive move out of this correction, it appears that this month’s advance is actually a B wave and the correction is still unfolding. The decline will likely resume soon with wave C.

http://www.elliottwave.com/images/ez.../Soybeans2.GIF

  1. Second, the current B wave advance began to stall at 781 1/2, which is a .618 retracement of wave A. As you may know, .618 is a common Fibonacci retracement percentage. This indicates that wave B is nearing exhaustion, and that wave C could now be underway.
  2. Third, during its advance above 781 1/2, wave B closed a price gap that originally opened during the slide from February’s high. And, as Jeffrey says, price gaps often act like magnets – first attracting prices and then repelling them. Now, that the February gap has attracted prices, it has begun repelling them, pushing Soybeans down to near 760 on April 3.

So, there you have it, three clear reasons why the Soybeans market behaved so erratically in March. Instead of guessing about crop hauls, Jeffrey believes the market jumped around because it is in a corrective phase, and corrections are much harder to predict than impulse waves.
The question is just how far will Soybeans slide before wave 2 ends and wave 3 begins.
 
 
  • Post #99
  • Quote
  • Apr 5, 2007 5:50pm Apr 5, 2007 5:50pm
  •  SeekingLight
  • Joined Jul 2006 | Status: Charts + PA > * | 3,251 Posts
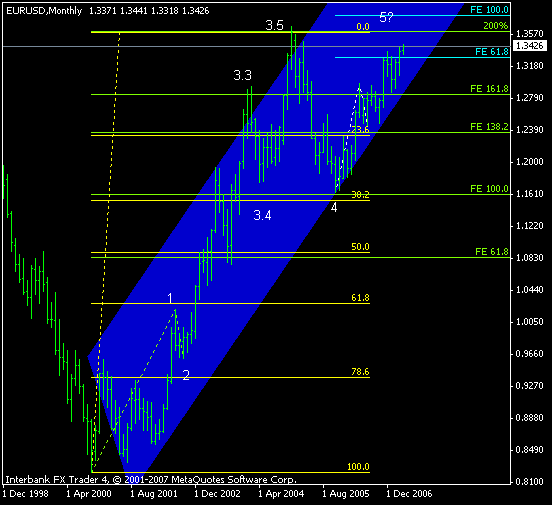
Hi again Itme

As you know, I rather prefer a KISS approach, in EW, too.

Here's a very, very simplified wave count for EURUSD on a long term timeframe.
According to this we could retest / challenge 1.36 soon.

I really really think it's best to simplify these counts as much as possible. I don't think big houses or players and especially long term players even bother with Subminuettes and whatnot. I assume they don't even think below full handles(100 pip increments -> 1.xx). Even if they do, I'm not smart enough for the complicated counts, so, you know, what can I do.

Either way, it matters not. Most important part - this count is simple, fits roughly and looks good to me AND coincides well with current direction. What more could I want?

Just another good excuse to look for long EURUSD setups until we retest those 2004/5 highs =)

Doesn't look that implausible, does it? Do you think it's an okay "toddler" version of an EW count?

Btw, glad to see you're cutting down pairs AND trades and waiting for the time one trade setup lines up. Focus and discipline is a very important part of trading and I, too still struggle with this biggest of all demons.

I would still recommend simply knowing the most basic price action stuff like a pin bar / doji formation, outside bars, inside bars and double highs/lows with lower/higher closes in order to get that little bit of extra edge and confirmation as well, but that's always been anyone's own choice whether or not one trusts these.
Pin bars alone as pointed out before can signal a nice resumption of the trend as a reversal after a correction - just line it up with a wave count and tadah, you're set to go =)


Best regards,

SeekingLight
Attached Image
Trust price. Know yourself.
 
 
  • Post #100
  • Quote
  • Apr 5, 2007 5:55pm Apr 5, 2007 5:55pm
  •  oedipean
  • Joined Mar 2006 | Status: Member | 55 Posts
Quoting itme
Disliked
Do you know how to tell a regular flat correction from an expanded one? While similar at first glance, they have different implications for the correction's ending price target. Watch this free clip from last Friday's (Mar. 23) Daily Futures Junctures Weekly Wrap-Up video where editor Jeffrey Kennedy analyzes an expanded flat correction in Pork Bellies.

Every Friday in his Weekly Wrap-Up, EWI's Chief Commodities Analyst Jeffrey Kennedy tells you about the hottest trends in commodity markets.

Watch this free clip from last Friday's (March 23) Daily Futures Junctures Weekly Wrap-Up, where Jeffrey analyzes Elliott wave patterns in Pork Bellies.

http://www.elliottwave.com/features/...ideo=3_26_2007
Ignored
Hi itme ,
thanks for link and thanks for useful threads , I watched the video , but I think he counted the waves wrongly , i mean where he named Wave 1 , i think he is wrong
what do you think about it ?
Attached Image
 
 
  • Rookie Talk
  • /
  • The Basics of Elliott Wave Theory
  • Reply to Thread
    • 1 234Page 56 7
    • 1 4Page 56 7
0 traders viewing now
  • More
Top of Page
  • Facebook
  • Twitter
About FF
  • Mission
  • Products
  • User Guide
  • Media Kit
  • Blog
  • Contact
FF Products
  • Forums
  • Trades
  • Calendar
  • News
  • Market
  • Brokers
  • Trade Explorer
FF Website
  • Homepage
  • Search
  • Members
  • Report a Bug
Follow FF
  • Facebook
  • Twitter

FF Sister Sites:

  • Metals Mine
  • Energy EXCH
  • Crypto Craft

Forex Factory® is a brand of Fair Economy, Inc.

Terms of Service / ©2023