• Home
  • Forums
  • Trades
  • News
  • Calendar
  • Market
  • Brokers
  • Login
  • Join
  • User/Email: Password:
  • 4:12am
Menu
  • Forums
  • Trades
  • News
  • Calendar
  • Market
  • Brokers
  • Login
  • Join
  • 4:12am
Sister Sites
  • Metals Mine
  • Energy EXCH
  • Crypto Craft

Options

Bookmark Thread

First Page First Unread Last Page Last Post

Print Thread

Similar Threads

Elliott Wave Theory 7 replies

The Fundamental Error of Elliott Wave Theory 36 replies

A more modern Elliott wave theory book? 2 replies

elliott wave theory 1 reply

Wave Theory 1 reply

  • Rookie Talk
  • /
  • Reply to Thread
  • Subscribe
  • 15
Attachments: The Basics of Elliott Wave Theory
Exit Attachments
Tags: The Basics of Elliott Wave Theory
Cancel

The Basics of Elliott Wave Theory

  • Last Post
  •  
  • 1 Page 23456 7
  • 1 Page 234 7
  •  
  • Post #21
  • Quote
  • Dec 14, 2006 11:30am Dec 14, 2006 11:30am
  •  itme
  • Joined Aug 2005 | Status: Member | 2,217 Posts
<table border="0" cellpadding="0" cellspacing="0" width="575"><tbody><tr><td valign="top">In the Zigzag

</td> </tr> <tr> <td width="6">
</td> <td>

By Nico Isaac

</td> </tr> <tr height="12"> <td height="12" width="6">
</td> <td height="12"> </td> </tr> </tbody></table> <table border="0" cellpadding="0" cellspacing="0" width="575"><tbody><tr><td width="6">
</td> <td class="EC_article" valign="top">OK. Close your eyes. Visualize what a typical zigzag shape looks like. Now, what images come to mind?

Lightening bolts – Sewing stitches – Zippers – The way grandma walks after one too many eggnogs.

Have an Elliott Wave analyst do the same exact exercise and chances are, ONE image and one image only will appear: Opportunity.

As for why – well, nothing explains that better than this labeled price chart from the December 8 Daily Futures Junctures Weekly Wrap-Up. Have a look-see.

http://www.elliottwave.com/images/ez...2012-13-06.gif

Voila! The very first pattern that pops out is the crisscross whish wash unfolding in Intermediate wave (4). That, my friends, is the very familiar shape known as a "Triple ZIGZAG."

Who here didn't see THAT one coming?

As for a formal definition, Elliott Wave Principle – Key To Market Behavior is an open book:

"A single zigzag is a simple three-wave pattern labeled A-B-C whereby the top of wave B NEVER moves beyond the start of wave A. Occasionally zigzags will occur twice or at most, three times in succession, particularly when the first zigzag falls short of a normal target. In these cases, each zigzag is separated by an intervening "X," producing what is called a double or triple zigzag. These formations are analogous to the extension of an impulse wave but are less common."

Now, as you can see from DFJ's close-up – which reflects the near-term price action underway in a major commodity market – once the triple zigzag is complete, Primary Wave 3 is set to begin.

Let's put it this way – if impulse patterns were snowmen, waves one and five would be FROSTY. Wave three… … … well … … … It would be the legendary Yeti, the Abominable snowman of the Himalayas, footprint the size of a four-door Sedan.

As a matter of fact, Ralph Nelson Elliott himself described third waves as "Wonders to Behold," which means, in plain English: This grain market is set to GAIN, big time.

The best part is, you can see DFJ's complete chart of this market along with 18 others in the December 8 Weekly Wrap-Up publication via a risk-free subscription today.

(Editor's Note: To read the Dec. 8 Daily Future Junctures, once you've subscribed, open the current DFJ and click on the Archives tab. You'll find plenty of other recently-identified opportunities in the Archives, too.)


</td></tr></tbody></table>
 
 
  • Post #22
  • Quote
  • Dec 16, 2006 5:07pm Dec 16, 2006 5:07pm
  •  itme
  • Joined Aug 2005 | Status: Member | 2,217 Posts
<table border="0" cellpadding="0" cellspacing="0" width="575"> <tbody><tr><td valign="top">What's the Count?

</td> </tr> <tr> <td width="6">
</td> <td>

By Alan Hall

</td> </tr> <tr height="12"> <td height="12" width="6">
</td> <td height="12">
</td> </tr> </tbody> </table> <table border="0" cellpadding="0" cellspacing="0" width="575"> <tbody><tr><td width="6">
</td> <td class="EC_article" valign="top">"Without Elliott, there appear to be an infinite number of possibilities for market action. Elliott’s highly specific rules reduce the number of valid alternatives to a minimum. Among those, the best interpretation, sometimes called the 'preferred count,' is the one that satisfies the largest number of guidelines. Other interpretations are ordered accordingly. [Those] second best interpretation[s are] sometimes called the 'alternate count.'

"Because applying the Wave Principle is an exercise in probability, the ongoing maintenance of alternative wave counts is an essential part of using it correctly. In the event that the market violates the expected scenario, the alternate count puts the unexpected market action into perspective and immediately becomes your new preferred count. If you’re thrown by your horse, it’s useful to land right atop another." Elliott Wave Principle – Key To Market Behavior, Ch. 2.

I have heard people equate switching to an alternate wave count with revising a failed prediction, saying it invalidates the Wave Principle. What is actually going on – as the quote above underscores – is a process of getting to know an unfolding chart pattern by applying Elliott’s rules in a methodical fashion.

Identifying wave patterns in charts is just like meeting somebody for the first time. When you meet a person, you begin taking in information; size, shape, age, personality, etc., and you begin making assumptions about how you expect this person to behave. Imagine everything’s fairly normal…

…and then the person tells you the intense, probing story of their alien abduction. Surprise!

You immediately change your assessment and revise your expectations. You have just done the social equivalent of choosing an alternate wave count.

Why didn’t you see that coming? Is there a flaw in your method for spotting alien abductees? Not really – there is some information that you just cannot know until the passage of time reveals it. Wave patterns are the same way.

For example, EWI's Stocks Specialty Service analyst Tom Denham switched to his alternate count for the German DAX stock index this Wednesday (Dec. 13). What happened?

Well, earlier, based on the market's hesitation, Tom "was convinced that a larger degree correction was underway." Here's one of his charts from last week:

http://www.elliottwave.com/images/ez...12-15-06-1.gif

But this week, Tom recognized that markets were not confirming his expectations. So he was flexible enough to accept reality and alter his opinion, after "one index after another pushed above anticipated resistance. Strong upside performance this week has shifted the weight of the evidence."

http://www.elliottwave.com/images/ez...12-15-06-2.gif

Market timing is what Elliott wave analysis is all about. And alternate counts are part of the method. There will always be uncertainty in trading and investing – that comes with the territory. But it can be minimized. When you apply Elliott to market data, you can eliminate much extraneous, confusing “noise” from your decision-making.

As Tom puts it, “If you are right on the market, you can be forgiven for changing the count.”

You could say that again.

</td></tr></tbody> </table>
 
 
  • Post #23
  • Quote
  • Dec 28, 2006 4:45am Dec 28, 2006 4:45am
  •  itme
  • Joined Aug 2005 | Status: Member | 2,217 Posts
<table border="0" cellpadding="0" cellspacing="0" width="575"><tbody><tr><td valign="top">
</td> </tr> <tr> <td width="6">
</td> <td>


</td> </tr> <tr height="12"> <td height="12" width="6">
</td> <td height="12"> </td> </tr> </tbody></table> <table border="0" cellpadding="0" cellspacing="0" width="575"><tbody><tr><td width="6">
</td> <td class="EC_article" valign="top">Those of you who regularly read EWI's Futures Focus column already know that our Futures Junctures editor Jeffrey Kennedy loves the Elliott wave pattern called the "diagonal triangle."

In Jeffrey's own words, “The diagonal triangle is hands down my favorite pattern because it lends itself very easily to trading.” Here are Jeffrey's answers to the four most important questions about this pattern:

What is a diagonal triangle? – A diagonal triangle is a five-wave overlapping move usually found within converging trendlines. Most importantly, it's usually an ending wave pattern found at the end of wave 5, or at the end of wave C in an A-B-C correction. Each wave of this pattern subdivides into three smaller waves:

http://www.elliottwave.com/images/ez...onal%20368.gif

How can you identify it? – It’s a very easy wave pattern to identify. The key to diagonal triangles is a five-wave, overlapping structure, typically bound by converging trendlines. This is a diagonal triangle in cocoa, for example:

http://www.elliottwave.com/images/ez...onal%20368.gif

What happens when a diagonal triangle ends? – It’s a very high-probability trading pattern because when it ends, a sharp reversal of price typically occurs. I’d say it will travel back to the origin of the price and then some at least 80% of the time. What's more, the move following the reversal will usually take 1/2 to 1/3 of the time that it took the diagonal triangle to form. For example, if it takes 10 days for a diagonal triangle to form, then, upon reversal, you can expect the price to retrace to its origin in three to five days.

How do you trade it? – This pattern lends itself very well to formulating a trading plan, i.e. protective stops, risk and targets. The way I formulate a trading plan depends on the direction in which the diagonal triangle develops. My initial expectation is to see the move more than fully retrace the origin of the price. If the diagonal triangle unfolds upward, I expect it to reverse drastically downward. If the diagonal triangle unfolds downward, I expect it to retrace to the price origin in an upward manner. A simple entry point I like to use is the break of the extreme of wave 4. My basic guideline for placing a protective stop is one tick past the extreme of wave 5. And I set my target and exit at the origin of the pattern.

*************************

Editor's Note: The Elliott Wave Principle works in any freely traded financial market in the world. Therefore, you will see diagonal triangles develop in any timeframe, and in any market: interest rates, forex, metals, individual stocks and stock indexes. EWI's Specialty Services – previously reserved mostly for professional traders – can help you identify this and other tradable wave patterns in dozens of global markets.

</td></tr></tbody></table>
 
 
  • Post #24
  • Quote
  • Dec 28, 2006 8:25pm Dec 28, 2006 8:25pm
  •  itme
  • Joined Aug 2005 | Status: Member | 2,217 Posts
<table border="0" cellpadding="0" cellspacing="0" width="575"><tbody><tr><td valign="top">Support for the Long Term

</td> </tr> <tr> <td width="6">
</td> <td>

By Morgan Lee

</td> </tr> <tr height="12"> <td height="12" width="6">
</td> <td height="12"> </td> </tr> </tbody></table> <table border="0" cellpadding="0" cellspacing="0" width="575"><tbody><tr><td width="6">
</td> <td class="EC_article" valign="top">What would you think if I told you that you could base an entire year’s worth of your trading strategy on what happens in January alone?

Wait, don't leave just yet: I’m not trying to sell you penny stocks, nor give you a get-rich-quick scheme. What I’m talking about is a legitimate application of Elliott wave analysis that can give you a good idea about where any market – specifically, any futures market – is headed. Yet it’s simple enough that anyone with a calculator can do it.

If you've heard of Elliott wave analysis, you've heard of Fibonacci numbers. It’s a sequence of numbers in which the sum of any two adjacent numbers forms the next higher number in the sequence: 1, 1, 2, 3, 5, 8, 13, 21… and so on into infinity. It’s a big part of Elliott Wave analysis that helps you to predict the duration of waves and the likely turning points – and that’s turning points in any timeframe, whether minutes, days, or much longer.

In fact, in his just-published December Monthly Futures Junctures, editor Jeffrey Kennedy shows that you can even use Fibonacci sequences to help lay out a trading strategy for an entire year.

He should know: He’s already done it.

Way back in February ’06, Jeffrey identified a year’s worth of Fibonacci resistance and support levels for 18 different futures markets by taking their January 2006 trading ranges (monthly high and low) and multiplying them by different Fibonacci ratios. He then followed those markets for 11 months – all along, using the support and resistance levels he had derived back in February '06 as a guide for his forecasts and trading strategies.

Jeffrey often says that resistance and support levels act as magnets, both pulling and pushing market trends. He repeats this point in December’s MFJ's Traders Classroom, too:

“As prices approach these support and resistance levels, be on the lookout for a possible reversal in price (i.e. a change in trend). If prices begin to stall as they approach these levels, a reversal in trend is likely. And, if prices slice through these levels as if they weren’t even there, then look for the current trend to continue on toward the next higher or lower [Fibonacci] number.”

By applying this knowledge, as early as February '06 Jeffrey identified warning signals to look for throughout the year – a way to know that a market is either approaching a turning point or getting ready to bust through to a new level.

And did it work?

According to charts you'll see in Jeffrey's latest, December MFJ, it did indeed work for many futures markets, including Cotton, Orange Juice, Soybeans, Wheat, and the Continuous Commodity Index. Each of those markets made significant turns throughout the year at or near the exact spots where they met Fibonacci resistance or support levels.

And while it’s by no means a foolproof way of achieving trading success, it’s certainly a nice frame of reference to have when looking at the big picture in commodity markets.

(Editor's Note: You can read the December Monthly Futures Junctures online right now, risk-free for 30 days.)

</td></tr></tbody></table>
 
 
  • Post #25
  • Quote
  • Dec 29, 2006 4:54pm Dec 29, 2006 4:54pm
  •  itme
  • Joined Aug 2005 | Status: Member | 2,217 Posts
<table border="0" cellpadding="0" cellspacing="0" width="575"> <tbody><tr><td valign="top">EURUSD: The Absence of Logical Trends

</td> </tr> <tr> <td width="6">
</td> <td>

By Vadim Pokhlebkin

</td> </tr> <tr height="12"> <td height="12" width="6">
</td> <td height="12"> </td> </tr> </tbody> </table> <table border="0" cellpadding="0" cellspacing="0" width="575"> <tbody><tr><td width="6">
</td> <td class="EC_article" valign="top">Forex may be the world’s largest and most liquid market, but the success rate among currency traders is the same as of all other market speculators – namely, the absolute majority of traders end up losing money.

To wit, the Financial Times reported last year that a small forex hedge fund was liquidated “due to disappointing performance.” It wouldn't be the first (or last) one, except for one detail: The fund was run by “an academic and currency guru well known in the industry as chairman of financial advisory firms, professor of commerce at Gresham College, and previously global head of research for State Street.”

That failed operation was one of many “momentum-driven” currency hedge funds that struggled over the past couple of years. BNP Paribas’ data showed that, “the average currency hedge fund lost 1.3% in 2004 and 1.7% in the first half of 2005.“

As the head of the failed fund put it, “The absence of trends had made things hard. The absence of logical trends makes it even harder still.”

Now we’re on to something. Just like the ill-fated Long Term Capital Management hedge fund that nearly collapsed the world’s financial system in 1998, many of today’s fund managers continue expecting the markets to behave logically. But markets rarely do, and forex markets are no exception.

As Elliotticians, we believe the markets are driven not by logic, but by fear and greed – that is, human psychology with all its pitfalls and illogical extremes. And Elliott wave analysis is the best method we know that helps predict how and when collective psychology may go through another shift – logical or not. It works more often than not; take a look at this forecast for EURUSD we made three weeks ago, for example:


[Note from Itme: EUR/USD topped December 8 at 1.3364, and subsequently fell 313 pips to 1.3051 on December 18, 2006.]


Wed, 6 Dec 2006 02:28:00 GMT

The year-long rally from 1.1641 is nearing an end, but could reach 1.3310, where wave five [of the larger wave 1] will be 61.8% of the net distance traveled in waves one through three, before it is complete.

http://www.elliottwave.com/images/ez...2012-29-06.gif

After hitting our upside target, the EURUSD has indeed been falling all month long. That's the helpful aspect of wave analysis: It helps you make better trading decisions by taking out the "logical" factors out of the equation. What you're left with is just waves – impartial, unemotional and precise.

</td></tr></tbody> </table>
 
 
  • Post #26
  • Quote
  • Jan 5, 2007 10:15pm Jan 5, 2007 10:15pm
  •  itme
  • Joined Aug 2005 | Status: Member | 2,217 Posts
<table border="0" cellpadding="0" cellspacing="0" width="575"><tbody><tr><td valign="top">So, You Wanna Learn Wave Analysis? Part II

</td> </tr> <tr> <td width="6">
</td> <td align="left"> By Alan Hall </td> </tr> <tr align="left" height="12"> <td height="12" width="6">
</td> <td height="12"> </td> </tr> </tbody></table> <table border="0" cellpadding="0" cellspacing="0" width="575"><tbody><tr><td width="6">
</td> <td class="EC_article" valign="top">The first article in this series covered the basics of Elliott wave patterns. Now let’s take a look at how we can (or can't) identify completed wave structures in order to see where the market is within that pattern. Then we’ll use the Three Rules of Elliott to decide where it is likely to go, and use "alternate counts" to order the probabilities.

Impulse waves are the most readily identifiable waveform. Like the main current in a river, they are relatively smooth and laminar. But corrective waves are more like eddies along a riverbank, complex and tricky, swirling back against the current.

Below is a chart of a five-wave move up within what is probably a larger impulse wave (1), followed by a three-wave move down within what is probably a larger corrective wave (2). We know that wave (1) is complete. How? Because a) its internal structure shows a clear five waves, and b) it is followed by a three-wave correction.

http://www.elliottwave.com/images/ez...201-4-07-2.gif

But do we know that the corrective wave labeled (2) is complete? The fact is we are not certain. But we can assign various probabilities to whether or not it's complete. That’s why we identify alternate counts, shown at the bottom as Alternate (A) and (B).

Alternate counts are essential to using the Wave Principle properly. They are not "failed predictions," or "bad" wave pattern interpretations. Alternate counts allow you to narrow down the infinite number of ways the market can move to just two or three. What's more, they allow you to rank these probabilities from highest to lowest. Alternate counts are an extremely helpful feature of wave analysis.

So, after a corrective three-wave move, here are the three possibilities that are most likely – ranked in order of probability:


  1. Most Likely: Wave (2) has ended and wave (3) is about to begin a strong upward move.
  2. Less Likely: Wave (2) has not ended, and could develop into a more complex three-wave structure.
  3. Least likely: Waves (1) and (2) are actually waves (A) and (B) of an upward correction within a larger impulsive downtrend. That's what the labeled alternate count in the above chart shows.

And here's the most exciting part. Although the three alternate counts describe different scenarios, the implication of each – if you think about it – is the same: The next trend is likely to be upward! So, as you can see, a careful look at your alternate wave counts can quickly lead you to an actionable trading strategy.

You should always remember that only the passage of time can reveal the developing pattern. There is no certainty about the position of the market, but using Elliott’s three specific rules will limit the possibilities, so you know when your count is valid, and when you should change to your alternate.

The Three Rules of Elliott give specific boundaries for a given count. In the chart above, for example, if wave (2) continues below the start of wave (1), thus violating Rule #1, then your originally preferred count would be instantly invalidated, and one of the alternates becomes preferred. These rules help eliminate subjectivity, define your strategy, reduce your risk -- and give you an edge in the markets.

In the next article, we’ll look at the use of Fibonacci ratios in market forecasting.


</td></tr></tbody></table>


  • Post #27
  • Quote
  • Jan 12, 2007 2:27pm Jan 12, 2007 2:27pm
  •  itme
  • Joined Aug 2005 | Status: Member | 2,217 Posts
<table border="0" cellpadding="0" cellspacing="0" width="575"><tbody><tr><td valign="top">Working 5 to 9

</td> </tr> <tr> <td width="6">
</td> <td>

By Morgan Lee

</td> </tr> <tr height="12"> <td height="12" width="6">
</td> <td height="12"> </td> </tr> </tbody></table> <table border="0" cellpadding="0" cellspacing="0" width="575"><tbody><tr><td width="6">
</td> <td class="EC_article" valign="top">Question: What’s the MOST correct way to label this market pattern?

http://www.elliottwave.com/images/ez...01-11-07-1.gif

No, this isn't a lesson in "fuzzy math." There really is more than one way to count Elliott waves in this chart. Interestingly, the implication for the trend is the same in both cases.

Let’s break it down. We see nine waves (five impulses and four corrections), and we know that the overall structure is impulsive. Why impulsive? Well, the waves don't overlap, that's your first clue. Secondly, this graph doesn’t fit any corrective patterns that R.N. Elliott described. And if that's an impulse, then you know that waves 3 or 5 are likely to be extended. The question is which one?

Now, before you start fretting over rules and guidelines, what if I tell you that for the overall trend, it doesn’t really matter? Don’t get me wrong, the wave count always matters, but what doesn’t, at least in this particular market (due to the fact the extension is almost indecipherable), is which subwave within this larger impulse wave is extended.

Because, here in the world of Elliott Wave, nine really does equal five. And once you learn why, you’ll realize it’s not so “fuzzy” at all.

When either waves 3 or 5 in a typical five-wave impulse pattern extend, you’re really dealing with nine waves, not five – the extension adds four waves to the overall pattern. For example, look at the chart of a third-wave extension below.

http://www.elliottwave.com/images/ez...01-11-07-2.gif

Count ALL the waves, including the unlabeled extension, and you finish with nine. And in Elliott wave analysis nine has the same implication as five, as Robert Prechter explains in his definitive book on Wave analysis, Elliott Wave Principle, Key to Market Behavior:

At times, the subdivisions of an extended wave are nearly the same amplitude and duration as the other four waves of the larger impulse, giving a total count of nine waves of similar size rather than the normal count of "five" for the sequence. In a nine-wave sequence, it is difficult to say which wave extended. However, it is usually irrelevant anyway, since under the Elliott system, a count of nine and a count of five have the same technical significance.

You'll see this pattern quite often, in all markets, not just commodities or stocks. Take this intraday chart of the euro/dollar from Monday (Jan. 8) presented by EWI's Currency Specialty Service, for example:

http://www.elliottwave.com/images/ez...01-11-07-3.gif

Anyone who can’t think in terms of nine could either mislabel this chart or spend hours trying to find the perfect extension. In the meantime, the market will have moved on, possibly completing its nine waves pattern and turning in the opposite direction – heading for a correction.

A correction you'd miss out on if didn’t know that in the world of Elliott wave analysis, 5 can and does equal 9. But now you do.

</td></tr></tbody></table>
 
 
  • Post #28
  • Quote
  • Jan 12, 2007 2:52pm Jan 12, 2007 2:52pm
  •  SunTrader
  • Joined Mar 2006 | Status: Trade the reaction not the news! | 10,419 Posts
A moderator needs to look into: Charts are not showing, just red X in a box.
 
 
  • Post #29
  • Quote
  • Jan 15, 2007 3:30am Jan 15, 2007 3:30am
  •  itme
  • Joined Aug 2005 | Status: Member | 2,217 Posts
Here is DailyFX's basic primer on Elliott Wave theory, including the psychological interpretation of the basic wave pattern:

http://www.fxcm.com/docs_pdfs/ElliotWave.pdf
 
 
  • Post #30
  • Quote
  • Jan 17, 2007 4:32am Jan 17, 2007 4:32am
  •  itme
  • Joined Aug 2005 | Status: Member | 2,217 Posts
Announcing the imminent release of RET: Forex 2007 Plugin – a critically important breakthrough for currency traders using the Refined Elliott Trader software

RET: Forex 2007 Plugin “tunes” the Refined Elliott Trader to Elliott Wave patterns found in current Forex (or currency) markets.
RET: Forex 2007 Plugin produces superior results when analyzing and forecasting currencies – substantially more accurate than using the standard “Stocks” and “Futures/Commodities” modules contained in the standard Refined Elliott Trader package.


Why the RET: Forex 2007 Plugin gives you superior forecasts on Forex markets:
In a nutshell: The standard Refined Elliott Trader’s pattern recognition database is based on US Stocks and US Futures/Commodities, not Forex. The RET: Forex 2007 Plugin gives you the ability to pattern match specifically to currency patterns found in current Forex markets. This is a world-first.


The two pattern recognition modules that come standard with the Refined Elliott Trader are:

  1. US Stocks (end of day only) 2003

  2. US Futures/Commodities (end of day only) 2003

The most common shapes of Elliott Wave patterns vary considerably from market to market, time frame to time frame, and orientation (moving up opposed to moving down).

Elliott Wave patterns also change over time. The common shapes of Elliott Wave patterns that Ralph Nelson Elliott documented in the US Stock market in the 1940’s are quite different from those found in the 21st century. So called “common” Elliott Wave patterns are not nearly as common as those found in current markets now.

The “US Stocks” and “US Futures/Commodities” pattern recognition database that Elliottician.com created in 2003 (which is included standard with the Refined Elliott Trader) was compiled from current markets up to that time.

Elliottician has documented significant differences in the common shapes of Elliott Wave patterns found in the stock market compared with those found in Futures/Commodities markets.

As you may know, several million patterns from current markets were distilled into the 2003 release of the Refined Elliott Trader. Consequently the Refined Elliott Trader is able to forecast with superior accuracy to its predecessor, the Elliott Wave Analyzer, which based its pattern recognition on stocks of the 1940s – being the standard published Elliott Wave algorithms.

At the time that Elliottician’s pattern recognition research was being carried out in 2001 through 2003, Forex had not become the popular market that it is today. And until 2003, the Refined Elliott Trader was only an end-of-day system – not “real time”. Consequently, neither Forex nor intra-day patterns were included in the research.

When forecasting a stock, the “Stocks” option within the software produces excellent results. In the same way, using the “Commodities/Futures” option produces excellent results when forecasting commodities and futures markets.

Which option should be used when analyzing a currency market – Stocks or Futures/Commodities?

Technically the answer is neither… but given that there has been no other option, then the pragmatic response has been: Whatever option gives the most accurate results.

Indeed, sometimes the “Stocks” option gives more accurate forecasts when analyzing currencies, and sometimes “Futures/Commodities”.

The problem is now solved. There is about to be another option: Forex 2007 Plugin

What’s more, when using the Refined Elliott Trader to forecast an intra-day market (such as hourly or minute data), it compares the patterns to the shortest available end-of-day time-frame patterns in the database. The results are reasonable – certainly better than using standard Elliott Wave – but not nearly as good as what is about to be possible with the RET: Forex 2007 Plugin.

Because common intra-day Elliott Wave patterns are significantly different from common end-of-day patterns, the RET: Forex 2007 Plugin includes all time-frames, from decades, down to daily, and right down to minute by minute currency market movement.


Typical Example of How the Refined Elliott Trader Forecasts Currencies More Accurately with the RET: Forex 2007 Plugin:

This chart is a typical example of analyzing a Forex market. Here we have an Elliott Wave forecast on the Euro/USD currency pair:

http://www.elliottician.com/images/s...ion/reteg3.gif
Refined Elliott Trader Forecast on the Euro

In the above analysis, the Refined Elliott Trader has correctly identified an Impulse starting near the beginning of March, with its Wave I completing near the beginning of June. However, because the software is matching this Impulse pattern against those known to be common in the stock market over this time span (months to years), it has determined that Wave II most probably completed in mid-July. This is because Impulse Wave 2’s are generally much shorter in time than Impulse Wave 1’s – at least, those found in stock markets. This is not the case with currencies, where wave 2 will often meander sideways for a considerable length of time compared with Wave 1. In this case, wave II did not complete until in mid-October.

Based on this “stock” analysis, a Euro trader would have been tempted to immediately enter the market late August and enjoy a bull run up Wave III – which actually did not begin for another three months.

Had the RET Forex 2007 Plugin been installed, RET would have correctly identified the market in August as a continuation of Wave II – giving the trader a more accurate forecast – and profitable trade - on a Forex currency market than has even been available before.

Suffice to say, matching Forex patterns to a Forex market will give superior forecasts than attempting to match either stock or futures/commodities market patterns to Forex markets.

Timeline of Development:


  1. 1994 - Development on the Refined Elliott Trader began (known initially as the Elliott Wave Analyzer).
  2. 1995 - First version of the Elliott Wave Analyzer is released - based on standard published Elliott Wave algorithms.
  3. 1998 - WinWaves developed in collaboration with Elliott Wave International. Bob Prechter worked with Rich Swannell for 18 months to improve the algorithms within the software, which was then released under the name of WinWaves.
  4. 2001 - The Elliott Research Project MK 1 commenced, identifying Elliott Wave patterns in real markets.
  5. 2003 - The Elliott Research Project MK 1 concluded with a total of 2 million documented patterns - the world's largest known database of real market Elliott wave patterns. The study comprised of US Stocks, Futures and Commodity markets.
  6. 2003 - The Refined Elliott Trader was released - being based on real patterns rather than accepted Elliott Wave algorithms. The Refined Elliott Trader accesses the Elliott Research Project Database to determine the most likely market direction. Included in the standard release: US Stocks 2003, US Futures/Commodities 2003.
  7. 2004 - The Elliott Research Project MK II commenced development - being a generation more sophisticated than its predecessor.
  8. 2005 - Real Time Plugin released for the Refined Elliott Trader.
  9. 2005 - Technical Indicators and Drawing Tools Plugin released for the Refined Elliott Trader.
  10. 2006 - Elliottician revamps all internal systems, including CRM, knowledge base, web servers and website in preparation for the release of its market specific databases (ie. Forex 2007 Plugin), forums and other processor and bandwidth intensive activities. This general Plugin took the majority of the year.
  11. 2007 - The RET: Forex 2007 Plugin released, the first of many market specific analysis options for the Refined Elliott Trader to be produced by the Elliott Research Project MK II in the near future.

The RET: Forex 2007 Plugin Provides Superior Forecasting Results for Currency Traders:
The RET: Forex 2007 Plugin substantially improves the ability of the Refined Elliott Trader to forecast Forex markets over all time-frames.


The specific nuances of Elliott Wave patterns in Forex markets have never been documented or analyzed before. This is a world-first, and may well cause a revolution in Forex trading.


If you trade Forex and want to dramatically improve your hit-rate, secure your RET: Forex 2007 Plugin today.


No longer do you need to try to match a Stocks or a Futures/Commodities pattern to your Forex chart. There is now a superior option – the RET: Forex 2007 Plugin.


The RET: Forex 2007 Plugin is break-through technology. Don’t trade Forex without it.


No Risk Guarantee:
If the RET: Forex 2007 Plugin module does not dramatically improve the Refined Elliott Trader’s ability to forecast more accurately on Forex markets, simply return it within 30 days for your money back – no questions asked.


It either serves you, or you don’t pay. It’s that simple.


Want to know more? Call and discuss RET: Forex 2007 Plugin with one of our helpful traders or client care representatives:+1-888-565-9283
Note: The RET: Forex 2007 Plugin needs a licensed copy of the Refined Elliott Trader to plug in to. If you don't already own one, simply add it to your order.

Additional Information about the RET Forex 2007 Plugin:
Since publishing the document above, we have received similar questions from a number of people. The answers to those questions are included below:


Before the Refined Elliott Trader, there was just one set of Elliott Wave algorithms – those documented by R. N. Elliott in the 1940's. These standard Elliott Wave patterns are still used on all markets, worldwide. As it is said, one size fits all.


For the first time in the history of Elliott Wave, the Refined Elliott Trader offered a better solution; Pattern matching based on real and current markets. The software went one step further by providing two pattern matching options – US Stocks and US Futures/Commodities.


Either of these options gives superior results to standard Elliott Wave on any market, be it Forex, or Indexes, or whatever.


Indeed, we have been using the standard Refined Elliott Trader for years to analyze Forex market ourselves – and have a track record to prove its accuracy. Sometime we get better results on Forex by selecting the Stocks option, sometimes Futures/Commodities. It takes experimentation.


The RET: Forex 2007 Plugin provides the Refined Elliott Trader software with a specifically designed database for analyzing Forex markets. It is quite able to analyze Forex without the Plugin, as has been thoroughly demonstrated. The RET Forex 2007 Plugin simply makes the software more accurate when forecasting currencies. A lot more accurate.


The RET Forex 2007 Plugin is the result of significant investment in new technology. We’ve had a team working on this since 2004. For your interest, considering the heavy investment in its creation, we have always planned to ask several thousand dollars for the Forex 2007 Plugin. We have gone against the advice of many by dropping the introductory price to a fraction of this amount so as to make the technology available to a much wider range of traders.


  • Post #31
  • Quote
  • Jan 17, 2007 5:38am Jan 17, 2007 5:38am
  •  itme
  • Joined Aug 2005 | Status: Member | 2,217 Posts
Market Minute
"As you know, the Wave Principle is a form of technical analysis based on crowd psychology and pattern recognition. But it is important to be aware of popular [news] headlines as well as know what the 'crowd' is thinking. Curious about [the ongoing] housing commotion and its possible effect on the commodity that houses are built of, I began to examine my long-term price charts of Lumber. What I see in them is the opposite of what [many recent] headlines imply…"
– Jeffrey Kennedy in the new, January issue of Monthly Futures Junctures (online now).


Double Eights: Single Opportunity

By Nico Isaac

When it comes to the Las Vegas Casino experience, there is one scenario we all dream of: Putting a quarter in the slot machine, pulling the handle, and watching as the cards flip around and around to land on Triple Sevens. Commence bells ringing, lights flashing, the Blue Man Group playing "He/She's A Jolly Good Fellow," and thousands of coins pouring out onto the floor beneath our feet.
Of course, we're more likely to get struck by lightening.
Which is not to say you should go out in a rainstorm carrying a metal rod. Our very own Futures Junctures Service editor Jeffrey Kennedy has found a far better way to rely less on chance and more on a proven method in the world of market forecasting.
And, in Chapter Nine of Jeffrey's Traders Classroom Collection Volume Two E-Book, he reveals the "winning combination" – Double Eights.
See, there are many kinds of Fibonacci proportions that develop as Elliott Wave patterns unfold in a market's trend: 1.00, .236, .382 to name a few. "Double Eights" get their name from the last digit of the relevant Fibonacci ratio: .618.
This set-up occurs when there are two consecutive tests of the .618 retracement. In Traders Classroom Collection, Jeffrey offers these two recent examples:

  1. Cocoa: Both the November 2004 and December 2004 advances retraced right up to the .618 level of their previous declines, initiating a significant sell-off into the January 2005 low.
  2. Coffee: Both the July 2004 and December 2004 declines retraced .618 of their previous rallies, kicking off a powerful rally to the February 2005 multi-year high.

As you can see, when "double eights" take place, great things happen. Technically speaking, they tend to position traders in front of wave three of C, third-of-third waves, or wave C of a contracting triangle – all patterns that trigger swift, sizable, and stunning moves.
In Jeffrey's own words: "If you can't make it to Vegas anytime soon, simply look for Double Eight's on your price charts and see if you experience the same thrill you get when winning a great big Jackpot."
Flash ahead to the January 11 Daily Futures Junctures, and say hello to Lady Luck. In that publication, Jeffrey spots a Double Eight trade set-up in Feeder Cattle's price action.
This scenario – along with a diagonal triangle taking shape – and the message is clear: "In feeder, we have what appears to be an exciting situation developing. If all goes according to plan, we'll see a strong, sizable move" in the coming days.


  • Post #32
  • Quote
  • Jan 17, 2007 5:48am Jan 17, 2007 5:48am
  •  itme
  • Joined Aug 2005 | Status: Member | 2,217 Posts
So You Wanna Learn Wave Analysis? Part III

The stock markets ended today, Tuesday, January 16, 2007
by Alan Hall

The first article in this series covered the basics of Elliott wave patterns.


The second article covered how to identify where the market is in the pattern, and discussed the use of "alternate counts." This article is about the Fibonacci sequence and the ratios within the sequence that guide the shape of Elliott waves. These ratios help traders establish support, resistance, and other price targets in the market.


Leonardo Fibonacci of Pisa was the most important mathematician of the Middle Ages. In 1202, he wrote a landmark book on arithmetic which popularized the decimal and Hindu-Arabic numbering system that we use today. In that book he referred to an additive numeric sequence derived from the growth of a population of rabbits.


The Fibonacci sequence begins with 1 and 1 (two lovestruck rabbits), and then progresses by adding each number to the one before it: 1, 1, 2, 3, 5, 8, 3, 21, 34, 55, 89 and so on. What is important to us as wave students is not so much the numbers themselves as the ratios between them.
As the sequence progresses, the ratios between adjacent numbers approach closer and closer to .618, or its inverse, 1.618 (depending on which of two adjacent numbers you divide by). The ratios between alternate numbers in the sequence are approximately .382, and 2.618. In fact, the nature of this additive sequence is such that you can start the sequence with any two numbers, and the ratios will rapidly approach .618. Try these examples with a calculator. For a fascinating list of phenomena relating to the Fibonacci sequence, consult chapter 3 of the Elliott Wave Principle.


Phi (.618034…), is an irrational number called the Golden Ratio. This ratio exists throughout nature -- in population growth, in the DNA helix, in plants, in the structure of the human brain, and in spiral structures from seashells to galaxies. R.N. Elliott's stunning discovery (made without a computer) was that this growth pattern found throughout the universe also shows up in stock market chart patterns. This could only mean that "man's collectively expressed emotions are keyed to this mathematical law of nature." (EWP)


Elliott was the first person to use Fibonnacci analysis in markets, and the correct usage of it can only be done within a valid Elliot wave interpretation. Many non-Elliott analysts try to find Fibonacci proportions between market moves that are unrelated to each other in any way, and this can make the approach appear far less valuable than it is.
Elliott had two main observations about Fibonacci relationships within waves.

  1. Corrective waves tend to retrace a Fibonacci proportion of impulse waves of the same degree. Frequent relationships between these waves are 38%, 50%, and 62%. (See the chart from the previous article.)
  2. Impulse waves of the same degree within a larger impulse sequence tend to be related to each other in Fibonacci proportion. (See the chart below.) At large degrees of trend these relationships usually occur in percentage terms. At small degrees, the number of points in each impulse wave reveals the ratios.

http://www.elliottwave.com/images/ma...tch/EWP1-3.jpg

These Fibonacci relationships occur in numerous ways in wave patterns, from the numbers of waves in a pattern, to their relationships to each other, and even in some cases the relationship between time-spans of waves.


That wraps up a brief introduction to the fascinating world of Fibonacci. Stay tuned for the next article in this series, where we'll address how to establish investment strategy and reduce risk in your trading. In the meantime, you can help yourself by studying the classic text, Elliott Wave Principle.


  • Post #33
  • Quote
  • Jan 17, 2007 1:35pm Jan 17, 2007 1:35pm
  •  itme
  • Joined Aug 2005 | Status: Member | 2,217 Posts
It's Not Complicated -- Just Truncated
1/8/2007 By Morgan Lee

When I made the jump into studying the Elliott Wave Principle not so long ago, I knew I was on to something special. Surely this theory would allow me to see perfect five-wave structures in any and every market!

Needless to say, it wasn't that simple. Not that it was the Principle's fault. It worked, but I was just another naïve, young pupil thinking I’d discovered a perfect cheat sheet.

After days and weeks of wondering why I couldn’t see perfect patterns in every market and worrying there was something wrong with me (or the method), I finally concluded that I must have not been applying Elliott in the best way.

When any hopeful Elliott wave apprentice gets to this point, it’s time to try a different approach. Looking for perfect, textbook wave patterns is a valid method, but…well, it's not a perfect world, so you may have to wait a long time for perfection – and that goes for market charts, too.

So, instead of looking for perfect five-wave set-ups each and every time, I started looking for other tell tale signs of a market about to make a move. The results were much more encouraging.

For example, there is a key Elliott wave structure that helped me get back on track – one that gives you a big hint to any market’s future: Truncations. That's what Elliotticians call a situation when, as opposed to a "perfect" five-wave structure, a fifth wave does not move beyond the end of a third wave, as seen in the chart below:


http://www.elliottwave.com/images/fu...201-8-07-1.gif

Truncated fifths indicate a market that is experiencing underlying buying or selling pressure against the overriding trend of the market. In the case of the chart above, this market was experiencing underlying selling pressure, and when it took over and forced an extreme change in the market, the fifth wave ended short.

If you remember just one thing about truncations, remember this: A truncated market is about to make a major turn either up or down.
In last Wednesday's (Jan. 3) Daily Futures Junctures editor Jeffrey Kennedy says he has found just such a structure in one particular market and predicts a big move ahead – in that case, to the downside.
What's more, not only did this futures market miss out on making a new fifth-wave extreme, it also features the added warning signal of an Ending Diagonal Triangle, as shown in the chart below.


http://www.elliottwave.com/images/fu...201-8-07-2.gif

And, as Jeffrey says in Jan. 3 DFJ, “a Diagonal Triangle that ends as a Truncated Wave means – watch out.” This market could be headed towards its September low over the coming weeks…
 
 
  • Post #34
  • Quote
  • Jan 19, 2007 3:30pm Jan 19, 2007 3:30pm
  •  itme
  • Joined Aug 2005 | Status: Member | 2,217 Posts
EURUSD: Looking for Clues

By Vadim Pokhlebkin

I don’t know about you, but for me this week's whipsaw price action in the euro/dollar has been frustrating. Moving without any clear trend, the EURUSD has made almost no net progress all week. And unless you are a skillful enough trader able to ride this "rollercoaster," trading this pair since Monday has been tough. (Not that it's ever easy.)

The forex media's explanation for this lack of direction is the "lack of clarity" regarding the U.S. economy and the Federal Reserve's next interest rate move. Analysts have been dissecting every economic report with the usual vigor, but the clues are conflicting. For example, the Jan. 17 news of a slowdown in foreign investors' purchases of U.S. stocks clearly was an argument not in the dollar's favor. On the other hand, the jump in the U.S. prices and housing starts announced today "added to speculation the Fed will delay any interest-rate cuts," which is good news for the buck (Bloomberg). Of course, the sluggish U.S. economic growth in the third quarter of 2006 hinted that the Fed could cut rates soon... And so it goes.

If you feel confused, you're not alone; "fundamentals" can be that way. A technical analysis perspective can bring in some clarity, though. All this meandering in the world's most traded currency pair can be summarized in one word: correction. Chiefly a technical term that defines a pause in the trend, corrections can be very drawn-out affairs when the market goes nowhere.

In the 1-2-3-4-5 impulsive Elliott wave sequence, only waves two and four are corrective. And as you can see from this chart below, our Currency Specialty Service analysts' latest thinking is that the market's hesitation this week has been a sign of the possible corrective wave (ii):

http://www.elliottwave.com/images/ez...%201-18-07.gif

As you can also see, there is a question mark next to that wave (ii) label. It means that the EURUSD still has to confirm or reject this wave count by breaking above or below certain support and resistance levels. What they are, and where this pair is most likely to move from here, you can find out right now with our Currency Specialty Service.
 
 
  • Post #35
  • Quote
  • Jan 19, 2007 4:40pm Jan 19, 2007 4:40pm
  •  Mama007
  • | Joined Oct 2006 | Status: MAMA007 | 176 Posts
itme

I know nothing about Elliott wave and I am interested something that could do the work for me. Does this plug in chart the patterns for you and would you be able to insert this indicator into any trading platform like metatrader
Sorry if this is a daft question!

Thanks
mama
 
 
  • Post #36
  • Quote
  • Jan 19, 2007 6:31pm Jan 19, 2007 6:31pm
  •  SeekingLight
  • Joined Jul 2006 | Status: Charts + PA &gt; * | 3,251 Posts
Hi,

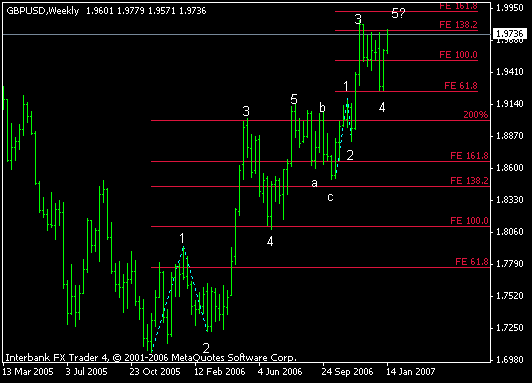
just was curious whether or not this was a valid way to count a possible VERY much simplified pattern on the GBPUSD weekly.

There are probably also several alternative counts by taking the entire rise as a wave 3 in more subdivisions, but I tried to keep it plain and simple and accepted b-c to be of equal size as a-b for the abc correction.
We could either get a truncated wave 5 now and flip at the 138.2% or continue on to the 161.8%.

Could be it's totally off, just wanted to post something like this once

Maybe you could say a thing or two about it when you find the time itme, but no hurry, I know you're already hard pressed for it.

Best regards,

SeekingLight
Attached Image
Trust price. Know yourself.
 
 
  • Post #37
  • Quote
  • Jan 19, 2007 9:25pm Jan 19, 2007 9:25pm
  •  itme
  • Joined Aug 2005 | Status: Member | 2,217 Posts
Dear SeekingLight,
Your wave count is generally in accordance with the basic theory of Elliott Wave, which is more than I can say for alot of charts I see on this forum. It is possible. But my count is different.

To the particulars: I believe your starting point is incorrect. I think your bottom of 2 is the beginning point of Wave 1, which is a failed fifth on the previous downtrend.

Wave 3's are almost all expanded, and Wave 4's are usually flats. This is a strongly bullish trend, so I think Wave 2 might be flat with over-throw. So the upper part of this trend is, I think, an expanded Wave 3. The last numbers on your chart - 1-2-3-4-5 are all the Wave 3 to me, or perhaps the first wave of an expanded Wave 3 with much higher upside potential.

On the other hand, your Wave 1, Wave 2, and Wave 3 may be correct. But if so, I believe that the steep Wave 3 is followed by a flat Wave 4 with overthrow on Wave B of Wave 4. That would put us into Wave 5 now. This is my second favorite hypothesis. I strongly disagree with your first 5. First of all, it implies a zigzag Wave 4, which is uncommon. Secondly, it implies an A-B-C corrective wave on the same order of your first 1-2-3-4-5 which are much too small - in fact of the wrong order.

The end result is the same - more upwards action to come. If fundamentals turn against GBP/USD too strongly, then the continuation of the trend will be abbreviated, resulting in a truncated or failed fifth wave.
 
 
  • Post #38
  • Quote
  • Jan 20, 2007 10:44pm Jan 20, 2007 10:44pm
  •  prentwo
  • | Joined Oct 2006 | Status: Member | 27 Posts
Itme this is my first post i just realy enjoy reading your post and threads as they are very informative. I think the recent US data has been positive of late and the market is waiting for negative data to propel upwards. I am not as good as you with the predicting of the tops and bottoms but i am trying to understand the elliot wave alot better. Do you think the use of pivot points are very useful. I have been using them the last month and i feel they are just as useful as the elliot wave counts. Any comments?? Thanks.
 
 
  • Post #39
  • Quote
  • Jan 21, 2007 5:03pm Jan 21, 2007 5:03pm
  •  itme
  • Joined Aug 2005 | Status: Member | 2,217 Posts
Prentwo, I have no idea what pivot points are good for. Could you elaborate please on what they are and how they can be useful, and / or provide a link to a good page or thread where this topic is elucidated? Thanks.
 
 
  • Post #40
  • Quote
  • Jan 22, 2007 9:21am Jan 22, 2007 9:21am
  •  prentwo
  • | Joined Oct 2006 | Status: Member | 27 Posts
Itme pivot points are points used to determine the daily support and resistance levels for a given currency. Of course it works better for more currencies than other but it is quite useful. you calculate the pivot points by using the high, low, and close of the day. Using the close time of 00:00 GMT. Once you have that you use this formula
R3 = (Pivot – S1) + R2
R2 = P + (H - L) = P + (R1 - S1)
R1 = (P x 2) - L
P = (H + L + C) / 3
S1 = (P x 2) - H
S2 = P - (H - L) = P - (R1 - S1)
S3 = Pivot – (R2 – S1)

If you compare the GBP/USD or EUR/USD for the last week on the 30 min charts you will see the price changes once they hit these particular pivots. I have read your other forum and i use this along with my trading system for help on profit taking.
 
 
  • Rookie Talk
  • /
  • The Basics of Elliott Wave Theory
  • Reply to Thread
    • 1 Page 23456 7
    • 1 Page 234 7
0 traders viewing now
  • More
Top of Page
  • Facebook
  • Twitter
About FF
  • Mission
  • Products
  • User Guide
  • Media Kit
  • Blog
  • Contact
FF Products
  • Forums
  • Trades
  • Calendar
  • News
  • Market
  • Brokers
  • Trade Explorer
FF Website
  • Homepage
  • Search
  • Members
  • Report a Bug
Follow FF
  • Facebook
  • Twitter

FF Sister Sites:

  • Metals Mine
  • Energy EXCH
  • Crypto Craft

Forex Factory® is a brand of Fair Economy, Inc.

Terms of Service / ©2023