• Home
  • Forums
  • Trades
  • News
  • Calendar
  • Market
  • Brokers
  • Login
  • Join
  • User/Email: Password:
  • 2:47pm
Menu
  • Forums
  • Trades
  • News
  • Calendar
  • Market
  • Brokers
  • Login
  • Join
  • 2:47pm
Sister Sites
  • Metals Mine
  • Energy EXCH
  • Crypto Craft

Options

Bookmark Thread

First Page First Unread Last Page Last Post

Print Thread

Similar Threads

Elliott Wave Theory 7 replies

The Fundamental Error of Elliott Wave Theory 36 replies

A more modern Elliott wave theory book? 2 replies

elliott wave theory 1 reply

Wave Theory 1 reply

  • Rookie Talk
  • /
  • Reply to Thread
  • Subscribe
  • 15
Attachments: The Basics of Elliott Wave Theory
Exit Attachments
Tags: The Basics of Elliott Wave Theory
Cancel

The Basics of Elliott Wave Theory

  • Last Post
  •  
  • 1 2Page 3456 7
  • 1 2Page 34 7
  •  
  • Post #41
  • Quote
  • Jan 23, 2007 1:13am Jan 23, 2007 1:13am
  •  itme
  • Joined Aug 2005 | Status: Member | 2,217 Posts
1/19/2007 5:58:25 PM Every Monday, Wednesday and Friday our our European Short Term Update tells you about Special Global Opportunities! The latest forecasts include the India Sensex Index, China's Shanghai Composite Index, Milan S&P/MIB Index and Madrid IBEX 35 Index. See the Jan. 19 issue of the ESTU for details. It's online now, part of the European Financial Forecast Service.

*****

The Dow Utilities sector has been investors' darling since late 2002. Over the past four years, the Dow Jones Utilities Average – an index comprised of fifteen largest energy service providers in the U.S. – has more than tripled, far surpassing the S&P 500, the benchmark against which every mutual fund manager measures their performance.


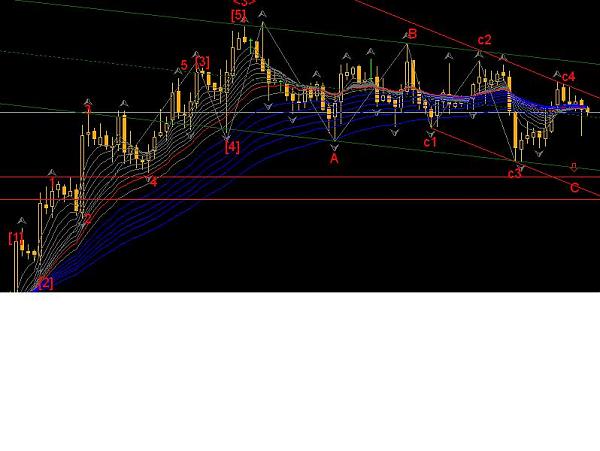
Here's a chart of one of the Dow Utilities stocks that illustrates the spectacular rally in the index:


http://www.elliottwave.com/images/ma...%201-19-07.gif


Some analysts say that utilities have performed so remarkably well because of the rising energy costs. Perhaps. But can you see in this chart any tell tale Elliott wave signs hinting at the direction the index may go from here?
Well, obviously – there is what looks like a completed five-wave structure from the mid-2002 low. That's one sign; there are more. In fact, why don't we let EWI's Prime Stocks Flash analyst do the talking:


1) Again, this Dow Utilities stock shows a five-wave rally from mid-2002.
2) Plus, "an impulsive decline has ensued from the December 2006 high."
3) On top of that, "this decline has already violated operative channels on the daily and weekly charts."
4) Last but not least, wave (5) in the chart above "has taken the shape of an ending diagonal, which appears complete, amidst momentum divergences."


This stock represents a large chunk of the Dow Utilities: 9 percent, to be exact. And in the words of our Prime Stocks Flash analyst, all the technical evidence combined points to "a large correction, at minimum." That's why this stock was the focus of a Prime Stocks Flash trading alert we sent to subscribers yesterday (Jan. 18), complete with specific trading recommendations and price target levels.
 
 
  • Post #42
  • Quote
  • Jan 23, 2007 9:24am Jan 23, 2007 9:24am
  •  prentwo
  • | Joined Oct 2006 | Status: Member | 27 Posts
That's a nice chart of the utilities index itme hopefully a major correction is coming and it has a positive effect on lowering the prices of energy. I was wondering have you any luck with the fibonacci ratios using the time method, when you are trying to count the days in advance for the price change.
 
 
  • Post #43
  • Quote
  • Jan 23, 2007 4:48pm Jan 23, 2007 4:48pm
  •  itme
  • Joined Aug 2005 | Status: Member | 2,217 Posts
Quoting prentwo
Disliked
That's a nice chart of the utilities index itme hopefully a major correction is coming and it has a positive effect on lowering the prices of energy. I was wondering have you any luck with the fibonacci ratios using the time method, when you are trying to count the days in advance for the price change.
Ignored
No, but I know someone who has. I hope to learn about the fibo time cycle patterns. How about you?
 
 
  • Post #44
  • Quote
  • Jan 24, 2007 9:45am Jan 24, 2007 9:45am
  •  SunTrader
  • Joined Mar 2006 | Status: Trade the reaction not the news! | 10,418 Posts
I use them all the time. Static and dynamic counts.
 
 
  • Post #45
  • Quote
  • Jan 24, 2007 10:12am Jan 24, 2007 10:12am
  •  krkvak
  • | Joined Nov 2006 | Status: Member | 33 Posts
Would you mind explaining / sharing them with us ?

I wish I could contribute to this thread too, but so far Itme is rocking the house

Thank you.

Quoting SunTrader
Disliked
I use them all the time. Static and dynamic counts.
Ignored
 
 
  • Post #46
  • Quote
  • Jan 24, 2007 5:51pm Jan 24, 2007 5:51pm
  •  SunTrader
  • Joined Mar 2006 | Status: Trade the reaction not the news! | 10,418 Posts
I use Dynamic Trader software to look for time periods for a change in trend so I have no EA to share.

But basically time projections are done just like price projections. For instance, a time retracement after a downtrend is done by taking the number of days from the previous swing high down to the swing low and then adding a fib ratio such as 61.8%, 100% or 161.8% of this amount to the date at swing low. The opposite for a swing low up to a swing high.

Time projections are similiar in that a fib ratio of a previous swing (high-low or vice versa) is added to the beginning of the next swing in the same direction.

A confluence of these two plus any standard cycle count of fib nbrs (3,5,8,13,21 etc), Gann nbr sqrs of 90, sqrs of 144 and anniversary dates.

Then these time zones along with price zones and bar patterns together signal almost 80%/85% of all trend changes.
 
 
  • Post #47
  • Quote
  • Jan 25, 2007 5:16am Jan 25, 2007 5:16am
  •  carforum
  • | Joined May 2006 | Status: Member | 48 Posts
hi itme,
how many years did you learn EW? because i am curious myself when i will i counting wave correctly! i have read another thread and know that you are very good at counting wave! but i am in trouble of WXYxxZ, i have buy 3 books about wave, may be my english is not good enough, it's hard for me to understand the correction wave of WXYXXZ! attach the picture showing USDX, not sure is that correct coz the wave C are not forming as a enindg diagonal, however the C1 and C4 is overlap!
Attached Image
 
 
  • Post #48
  • Quote
  • Jan 25, 2007 8:42am Jan 25, 2007 8:42am
  •  prentwo
  • | Joined Oct 2006 | Status: Member | 27 Posts
i am not even an novice in elliot wave theory i have about 3 books on the topic but i haven't read them to the extent that i would consider myself even an novice. I think reading your other forum on the elliot wave i have no choice but to study them.
 
 
  • Post #49
  • Quote
  • Jan 25, 2007 9:43am Jan 25, 2007 9:43am
  •  SeekingLight
  • Joined Jul 2006 | Status: Charts + PA > * | 3,251 Posts
Does anyone else use FE / Fib expansions to figure out wave endpoints?
FE 61.8 = weak wave
FE 100 = normal wave
FE 161.8 = extended wave

If you manage to count correctly you will have a good idea of where the current move might start exhausting / end it's third and strongest wave.

Attaching an example....
Attached Image
Trust price. Know yourself.
 
 
  • Post #50
  • Quote
  • Jan 25, 2007 12:52pm Jan 25, 2007 12:52pm
  •  SeekingLight
  • Joined Jul 2006 | Status: Charts + PA > * | 3,251 Posts
I attached my supersimple "moron's way of counting waves" simply going by basic FE + 12345 logic.

No idea how "wrong" I am, but I think simple pattern recognition of impulses as wave 3 works not too shabby sometimes, trouble of course being you want to be in at the end of 2, not at the end of 3
Although if you can catch the end of 4, then 5 isn't too bad a trade, either, I'd guess.

Would love to hear your opinion again on this chart itme, whether it works out or not =)

Cable has been behaving very strangely today...

What size is Wave 5 normally? Is there a fixed (fib?) relation to other waves that occurs a lot? All I know is basic manual projection of Wave 3 and that preferably waves don't go past prior wave origins, so as not to invalidate the count...
Didn't stop oil from misbehaving today, I had a very precise target which was hit with 100% precision, but not before spiking 15 pips past the waves origin. It was a real shame and behavior like this makes stop management VERY problematic.

Regards
Attached Image
Trust price. Know yourself.
 
 
  • Post #51
  • Quote
  • Jan 25, 2007 7:03pm Jan 25, 2007 7:03pm
  •  SeekingLight
  • Joined Jul 2006 | Status: Charts + PA > * | 3,251 Posts
Completed a full 12345 wave count and fit all proportions. No idea what subwave of which larger wave it was/is, but it finished at the low accoding to my theory. Attaching chart.
Attached Image
Trust price. Know yourself.
 
 
  • Post #52
  • Quote
  • Jan 26, 2007 1:53am Jan 26, 2007 1:53am
  •  surfer76
  • | Joined Nov 2006 | Status: Member | 51 Posts
Hi SeekingLight,

like your analysis.

My main analysis at the moment is: Wave 5 of a larger Wave 4 has finished at 1.9625. The monthly pivot is at the same price.

Now I hope that we will see a 5th wave up.
 
 
  • Post #53
  • Quote
  • Jan 26, 2007 4:09am Jan 26, 2007 4:09am
  •  SeekingLight
  • Joined Jul 2006 | Status: Charts + PA > * | 3,251 Posts
Here's my supersimple USDCHF.

Got in at the Wave 4 that went too low. Is this allowed? I'm a bit worried it went lower than 50% of my Wave 3 and under the high of Wave 1.
The whole Wave is subwaves of a bigger Wave 5 I believe that might be headed for around 1.2550+.
No Idea what happens next now - abc? Continuation? Something? Really don't know.
Any advice is appreciated - what's most likely after a Wave 5 in USDCHF?
Attached Image
Trust price. Know yourself.
 
 
  • Post #54
  • Quote
  • Jan 26, 2007 6:33pm Jan 26, 2007 6:33pm
  •  itme
  • Joined Aug 2005 | Status: Member | 2,217 Posts
The market's compound construction is such that two waves of a particular degree subdivide into eight waves of the next lower degree, and those eight waves subdivide in exactly the same manner into thirty-four waves of the next lower degree. The Wave Principle, then, reflects the fact that waves of any degree in any series always subdivide and re-subdivide into waves of lesser degree and simultaneously are components of waves of higher degree. Thus, we can use the attached diagrams to illustrate two waves, eight waves or thirty-four waves, depending upon the degree to which we are referring.
Attached Images
 
 
  • Post #55
  • Quote
  • Jan 26, 2007 6:41pm Jan 26, 2007 6:41pm
  •  itme
  • Joined Aug 2005 | Status: Member | 2,217 Posts
About 99% of the time the market plays out the following pattern. Once in a while a powerful announcement of world events causes a break of the pattern. The shapes and proportions can be stretched or compressed by events, announcements, market psychology, support and resistance barriers and other technical factors, but the following pattern nevertheless pretty much always plays out.

Number of Waves at Each Degree
Impulse + Correction = Cycle

Largest waves 1+1=2
Largest subdivisions 5+3=8
Next subdivisions 21+13=34
Next subdivisions 89+55=144
http://images5.pictiger.com/thumbs/b...517a9be.th.gif
 
 
  • Post #56
  • Quote
  • Feb 2, 2007 6:13pm Feb 2, 2007 6:13pm
  •  itme
  • Joined Aug 2005 | Status: Member | 2,217 Posts
Back to Basics

By Nico Isaac


In my senior year of high school, I took honors calculus. On the first day of class, the teacher gave everyone a one-question quiz that has stuck with me to this very day:

"Johnny has built a rectangular fence around his garden that is 14 feet long by 12 feet wide. He wants to paint the fence a color that costs $8 per gallon. The hardware store employee says one gallon should easily cover 42 square feet. How much will Johnny spend on the entire project?"

First I remember muttering under my breath -- "Who does this guy think he is? I can do this stuff with my eyes closed!" These gripes were quickly cut short by the giant foot shoved into my mouth.
Don't miss the February 2007 issue of The Elliott Wave Financial Forecast (online now) where you'll find an in-depth discussion of the parabolic rise in Chinese equities, see multiple instances of where it has occurred before – and most importantly, learn how it affected those particular markets.
Big shocker: I had completely forgotten how to solve this problem from freshman year pre-algebra. I wasn't alone. The professor had made an unforgettable case: "True learning," he said "does not progress from A to Z." If you don't continually look back and return to the building blocks from which it all began, "you're only as smart as the semester is long."

In his honor, we return to the basics of the Elliott Wave Principle via this labeled price chart from the January 31 Daily Futures Junctures:

http://www.elliottwave.com/images/ez...o%202-1-07.gif

If you're like most Elliott Wave veterans, the first thing to pop out of this picture is a leafy green vegetable. No, I haven't fallen off the turnip truck. I'm referring to the three sets of five-wave formations that stand out in the chart – a classic illustration of the FRACTAL nature of Elliott Waves.
Think: Broccoli Stalk, where each floret can be broken down into smaller scales of smaller florets, identical in all things save size.

In the case of DFJ's chart, we have Intermediate waves (1) through (5) in which wave (3) subdivides into Minor waves 1 through 5, in which wave 3 further subdivides into minute waves (i) through (iv).
As for the five-wave pattern itself – well, this is the One Overriding Form of Market Progress, from which all 13 Elliott Wave patterns stem.

Within this pattern, waves 1, 3, and 5 are called "motive," those that move with the direction of the larger trend, propelling prices forward. Wave 2 and 4 are "countertrend" moves. Most importantly, there are Three Main Rules to Five Wave Patterns that are as ageless as the arithmetical law a + b = b + a:

  1. Wave 2 never moves beyond the start of wave 1
  2. Wave 3 is never the shortest wave and always moves beyond the end of wave 1
  3. Wave 4 never enters the price territory of wave 1, with the exception of a diagonal triangle.

Now that we've taken a few steps back, we can move onto the future; namely, the in-depth analysis that the January 31 DFJ presents for the major grain market depicted in this chart.


  • Post #57
  • Quote
  • Feb 2, 2007 6:28pm Feb 2, 2007 6:28pm
  •  itme
  • Joined Aug 2005 | Status: Member | 2,217 Posts
Quoting SeekingLight
Disliked
Here's my supersimple USDCHF.
Got in at the Wave 4 that went too low. Is this allowed? I'm a bit worried it went lower than 50% of my Wave 3 and under the high of Wave 1.
The whole Wave is subwaves of a bigger Wave 5 I believe that might be headed for around 1.2550+.
No Idea what happens next now - abc? Continuation? Something? Really don't know.
Any advice is appreciated - what's most likely after a Wave 5 in USDCHF?
Ignored
You make some very sensible points here, SeekingLight, and I think you were correct. The high reached was 1.2575, just 25 pips higher than your projection. The wave can always go further. The Fourth Wave can go down (or up) as little or as far as it likes - even to the beginning of Wave 1, but it usually goes to about the end of Wave 1.

After the end of Wave 5 we start a new Wave down. To know what comes next on the larger scale, whether an A-B-C or a 1-2-3-4-5, one needs to look at the one day chart. A Wave 5 is the end of a 5 wave pattern, which could be the end of, on a larger scale, one of the following:

a larger Wave 1.......followed by larger Wave 2 (A-B-C)
a larger Wave 2A.....followed by larger Wave 2B (a-b-c)
a larger Wave 2C.....followed by larger Wave 3 (1-2-3-4-5)
a larger Wave 3.......followed by larger Wave 4A (1-2-3-4-5)
a larger Wave 4A.....followed by larger Wave 4B (A-B-C)
a larger Wave 4C.....followed by larger Wave 5 (1-2-3-4-5)
a larger Wave 5.......followed by larger Wave 1 (1-2-3-4-5)

All of the above waves on the left are 5 wave patterns. What comes after each one depends on its position in the bigger pattern.
 
 
  • Post #58
  • Quote
  • Feb 7, 2007 9:09am Feb 7, 2007 9:09am
  •  itme
  • Joined Aug 2005 | Status: Member | 2,217 Posts
Cotton, Corn and Feeder Cattle: Watch This Video

By Morgan Lee and Jeffrey Kennedy

You know that at Elliott Wave International, we use a lot of pictures and charts. So, to introduce our first-ever video version of Futures Focus, we thought it would be appropriate to show, not tell.

In this special video issue, EWI's Chief Commodities Analyst Jeffrey Kennedy shows you several charts from his latest Weekly Wrap-Up and tells you about important trends he sees in commodities markets.


Watch this first-ever video edition of Futures Focus

So You Wanna Learn Wave Analysis, Part IV
By Alan Hall

The first article in this series covered the basics of Elliott wave patterns.

The second article showed how to identify where the market is in the pattern, and discussed the use of "alternate counts." The third article was about the Fibonacci sequence and the ratios within the sequence that guide the shape of Elliott waves. This one is about establishing investment strategy and reducing risk.

Elliot's wave-counting rules and the price-targeting utility of Fibonacci relationships together are effective tools for establishing a methodical investment strategy and limiting your risk exposure. You get a rule set for deciding when to enter or exit a position, or terminate a strategy. The Wave Principle helps you identify the highest probability direction for the market, craft an optimum position to take advantage of it, while guarding yourself against the less probable outcomes. That is a significant edge, and if you want to win in markets, you need an edge.

The chart below shows a real example of the coffee market reaching a point like what was shown in the idealized chart in the second article.

http://www.elliottwave.com/images/ez...ts/emw5-07.gif


The lowest point on the chart is the end of a larger degree decline, and at that point, an Elliott practitioner would be expecting at least a three-wave move up at the same degree. As you can see, a five-wave upward move, labeled 1, occurred over about two weeks, followed by wave 2, an a-b-c correction. Wave 2 is a classic example of a correction, with sub-waves a and c subdividing into five waves, and wave b subdividing into three waves. Familiar third wave gaps are visible near the middles of both impulse waves, a and c.
Once you have seen wave a move downward in five waves, you know wave 1 to the upside is probably complete. Now you know to expect upward wave b, a three-wave move, and you can set Fibonacci price targets for the end of wave 2. In a typical five-wave impulse sequence, wave 2 most often retraces 62% of the preceding wave 1. The next most common retracements are 38% or 50%.


Study this chart, and make your own analysis of what you think actually happened next, and later this week I'll post the last article in this series. Meanwhile, to continue your studies, the original classic, Elliott Wave Principle is the best textbook on the subject. To gain perspective on how this method teaches you to think independently, you can join Club EWI and download the Independent Investor eBook, all for free.
 
 
  • Post #59
  • Quote
  • Edited 1:55pm Feb 10, 2007 1:37pm | Edited 1:55pm
  •  itme
  • Joined Aug 2005 | Status: Member | 2,217 Posts
Market Minute
"The Japanese currency has fallen to multi-year lows against the dollar, euro and sterling in recent months amid increasing investor appetite for carry trades, in which long positions in high-yielding currencies are funded by selling low-yielding currencies such as the yen."– The Financial Times, Feb. 09.

By Vadim Pokhlebkin

Let's talk about a couple of the less widely traded currency pairs for a change. Both pairs have been in the news a lot lately – they are, of course, the euro-yen and the euro-pound cross rates.

Yesterday (Feb. 8), "the euro approached a record high versus the yen and reached its strongest against the pound in almost a month," reported Bloomberg. Why? Because, "European Central Bank President Jean-Claude Trichet suggested policy makers were poised to raise interest rates next month."

So it's back to interest rates again. "The interest-rate outlook favors the euro," say the analysts. But even if you believe wholeheartedly that the ECB will indeed raise rates next month, is that reason enough to be bullish the euro? I don't know about you, but this strategy doesn’t sit well with me.

First of all, "strong vigilance against inflation" or not, the ECB may decide against the hike. And secondly, we've all seen days when the ECB (or the Fed) would raise rates, but the EUR (or the USD) would crash, not rally. That doesn't make much sense, but it happens.

Fortunately, we can apply Elliott Wave analysis to both the EUR/JPY and the EUR/GBP and get another clue at their respective trends. We cover both crosses daily in EWI's Currency Specialty Service; here are a couple of the latest charts. Let's see if we can gauge what's going on here from a technical analysis perspective:

http://www.elliottwave.com/images/ez...202-9-07-1.gif

http://www.elliottwave.com/images/ez...202-9-07-2.gif

As you can see, the larger wave patterns are different in each pair. What is the same, however, is that both the EUR/JPY and EUR/GBP are likely in the ending stages of their respective ABC patterns. And if you remember one thing about ABC's, remember this (well, it's actually two things):

  1. ABC patterns are always corrections
  2. When an ABC ends, the larger trend resumes. That's why, while some traders get tricked by an ABC into thinking that the ride is over, an Elliottician knows that an ABC is actually a confirmation of the bigger trend. The market just needed to rest for a while.

You decide whether or not Trichet's promise of "vigilance" is enough of a reason to be bullish the euro. As for me, forex traders' mass psychology, reflected in the markets' Elliott wave patterns, seems like a much more promising indicator.


  • Post #60
  • Quote
  • Feb 10, 2007 2:01pm Feb 10, 2007 2:01pm
  •  itme
  • Joined Aug 2005 | Status: Member | 2,217 Posts
One reason the Elliott Wave Principle works well is that it is 100% technical. "No armchair theorizing from economics and politics is required," as Bob Prechter says. But nothing is perfect, and even the most ardent Elliott wave student will be interested to learn that the Wave Principle has some shortcomings. Once you understand these, you can see that wave analysis is like a deeply interesting and mind-challenging chess game.
Learn more in this question-and-answer with a journalist taken from the book, Prechter's Perspective.

* * * * *

Excerpted from Prechter's Perspective, 2004 edition

Q: What are the Wave Principle's biggest shortcomings?

Bob Prechter: There is one main weakness, and this accounts for just about all the problems. There are 11 different patterns for corrections. When a correction starts, it is impossible to tell in advance which pattern has begun, so you do not know how it is going to unfold. Therefore, the best that you can do is apply some of Elliott's observations as guidelines in making an intelligent guess as to what it is.

Another problem is duration. Corrections can do what Elliott called "double" or "triple" – that is, repeat several times. Triple corrections are the largest formations possible, so at least there is a limit. These repetitions can be frustrating, because they can last decades. For example, we had a 16-year sideways correction in the Dow Jones Industrial Average from 1966 to 1982. A.J. Frost and I thought it was over in 1974 and that the market was ready for another bull wave. To be sure, most stocks rose from that point forward, but the Dow went sideways for another eight years in a doubling of the time element, which caused some frustrations before the next bull wave finally began on August 12, 1982.

Another problem is that in rare cases, a wave will contain no extension, such as the advance in November-December 1976, or two extensions, such as the bull market from 1974 to 2000. Those rarities can be frustrating.

Q: It sounds like a chess game. The number of possibilities, and therefore the probabilities of success, varies at certain junctures.

Bob Prechter: Chess provides an excellent analogy. The market can do whatever it wants, except that it will always do it in an Elliott wave structure. Similarly, your opponent can move chess pieces wherever he wants, except that he must follow basic rules. On the other side of the board, you still have a lot of hard thinking to do despite your absolute knowledge that pieces must move according to those rules.

Q: Are there situations where the Wave Principle does not hold true?

Bob Prechter: No. It always holds true. But, of course, it is one thing to say the markets will follow the Wave Principle and another thing entirely to forecast the future based on that knowledge: It is always a question of probabilities. Once you have hands-on experience with it, once you understand all the rules and guidelines, it is a lot like becoming Sherlock Holmes. There are many possible outcomes, but guidelines force you along certain paths of thinking. You finally reach a point where the evidence becomes overwhelming for a certain conclusion.

Q: Have you ever had a case where you thought the probability of a certain outcome was high, say 90%, but the market went otherwise from your expectation? What did you do then?

Bob Prechter: Of course it happens. But you should never be wrong for long relative to the degree that you are trying to assess. One of the terrific things about the approach is that it's price that tips you off. With other approaches, price can go a long way before the reason behind your opinion changes, if it ever does. No matter how difficult the pattern is to read sometimes, it always resolves satisfactorily into a classic pattern.

Q: Can you illustrate how knowledge of "wave structure" comes into play when trading?

Bob Prechter: For instance, the bottom of the fourth wave, which is a pullback, cannot overlap the peak of the first rally. If it does, then it's not a fourth wave. The fourth wave is still ahead of you, and the third wave is subdividing. Knowing this tenet can keep you out of a lot of trouble that an armchair wave analyst would encounter. Another basic tenet is that wave three is never the shortest wave. It is usually the longest. Wave three is the recognition stage when the majority changes the orientation from bearish to bullish or vice versa.

Q: But if there is always a correct pattern, and it is only a matter of seeing it, why aren't accuracy levels higher than the 40%, 50%, 60% or even the 80% ratios of hits to misses?

Bob Prechter: First, just because R.N. Elliott discerned that the market follows rules as in a chess game doesn't mean you can predict the market's next move. All you can give are probabilities.
But the psychological difficulties are at least an equal impediment. Hamilton Bolton once said that the hardest thing he had to learn when using Elliott was to believe what he saw. Despite all I know, I have fallen prey to that problem more than once. The fact that even perfect analysis only results in the best probability provides the uncertainty that feeds the psychological unease. As A.J. Frost is fond of saying, "The market always leaves its options open."
So when you combine human weakness with a game of probability, the result is many errors in judgment. Nevertheless, I must stress that the ratio of success with Elliott is better than that with other approaches, and that is the only rational basis for judging its value.
Besides, the inestimable value of the Wave Principle is not so much that it provides a high percentage of correct "calls" on the market, but that it always gives you a sense of perspective.
 
 
  • Rookie Talk
  • /
  • The Basics of Elliott Wave Theory
  • Reply to Thread
    • 1 2Page 3456 7
    • 1 2Page 34 7
0 traders viewing now
  • More
Top of Page
  • Facebook
  • Twitter
About FF
  • Mission
  • Products
  • User Guide
  • Media Kit
  • Blog
  • Contact
FF Products
  • Forums
  • Trades
  • Calendar
  • News
  • Market
  • Brokers
  • Trade Explorer
FF Website
  • Homepage
  • Search
  • Members
  • Report a Bug
Follow FF
  • Facebook
  • Twitter

FF Sister Sites:

  • Metals Mine
  • Energy EXCH
  • Crypto Craft

Forex Factory® is a brand of Fair Economy, Inc.

Terms of Service / ©2023