actually im still new in elliot wave principle.So far i can the spoken wave but i still have problem to determine the unspoken such as basic corrective and complex. One more thing i still can predict the market trend using Fibonacci when the wave arrive at corrective wave.. a b and c.
Similar Threads
Elliott Wave Theory 7 replies
The Fundamental Error of Elliott Wave Theory 36 replies
A more modern Elliott wave theory book? 2 replies
elliott wave theory 1 reply
Wave Theory 1 reply
- | Joined Jul 2005 | Status: Member | 518 Posts
Could someone please post and Elliott wave indicators
or direct me to where i could find them
Thank
Troy
or direct me to where i could find them
Thank
Troy
- Joined Aug 2005 | Status: Member | 2,217 Posts
- Do you know how to identify a fourth wave correction in a market?
- Do you know where a fourth wave is likely to end?
- Do you know a simple Fibonacci ratio that helps you calculate a fourth wave's actual price target?
Watch this free video clip where EWI's Chief Commodities Analyst Jeffrey Kennedy uses Feeder Cattle to give you several quick tips on how to do all that – and more.
Feeder Cattle is just one of the nineteen Softs, Grains, Livestock and Metals futures markets, plus the Continuous Commodity Index, covered in the February 23 Weekly Wrap-Up.
(See the Feb. 23 Daily Futures Junctures for complete analysis; online now.)
Feeder Cattle: Watch This Free Clip
- Joined Aug 2005 | Status: Member | 2,217 Posts
Make on the Break
2/23/2007 5:01:35 PM
By Morgan Lee
The thought of market corrections scares a lot of traders. They are choppy, unpredictable and ugly to look at on a chart. But they are also an opportunity waiting to happen – if you know what to look for.
Most traders usually just wait for a correction to end. They want to see that impulse wave that breaks away and shoots out of the slump. But to find that opportunity, you’ve got to study the slump itself.
That’s why Daily Futures Junctures editor Jeffrey Kennedy spends much of his time scanning the markets for corrective wave patterns, as he notes in his Trader’s Classroom eBook:
“R.N. Elliott’s work allows me to identify countertrend moves within trending markets. Because I’m familiar with these patterns and characteristics, I can determine the most likely points where and when countertrend moves will end.”
How does Jeffrey know when a correction is taking its last breaths? By using a combination of wave counts and other technical analysis tools such as price channels.
As you know, corrections are typically three-wave structures that go against the overall trend of the market. You may also know that corrections almost always develop inside parallel lines, known as price channels. So when a correction breaks out of its price channel, it could be a sign that said correction is over.
Trouble is, sometimes a channel break means that the correction simply attained a price extreme and will soon return inside its channel – that's a so-called fake breakout. How can you increase your confidence that a channel breakout is for real? Apply a wave count to the charts – and exercise patience.
For example, in this chart from Wednesday’s (Feb. 21) Daily Futures Junctures, editor Jeffrey Kennedy shows one particular commodities market finally ready to break out of a month-long slump:
http://www.elliottwave.com/images/ez...ffeeII2.23.GIF
Two things give Jeffrey confidence in his forecast:
- First, this market appears to have ended C wave of a double Zigzag correction. That doesn’t mean the correction has to end there, but it’s certainly a place where the market could turn.
- Second, this market has just shot up and blown through the upper trendline of its price channel. As you know, quick, decisive wave movements are usually signs of an impulse wave, not a correction.
And here's where patience comes in. Jeffrey says we will only know if this move has the staying power a few days from now:
“What I would like to see next is a decisive move past 122.30 followed by a three-wave decline. If prices do indeed trace out a five-wave advance followed by a three-wave pullback, we should have all the confirming price action we need to signal that higher prices are most certainly on the horizon.”
So, while you may be mired in a correction, using wave analysis, you can always keep your eye on the horizon above – because you’ll know a turn is coming soon.
http://www.elliottwave.com/features/...d=2909*time=pm
- Joined Aug 2005 | Status: Member | 2,217 Posts
Two experienced elliotticians - Elliott Wave International and ElliottExchange - warned me yesterday that a major stock market correction was imminent. They were both smack on. Chalk one up for Elliott Wave theory.
For example, yesterday I received this notice from Elliott Exchange. This was the only special notice that I have received from this experienced elliottician in over 6 months:
Ready for the Coming Market Collapse?
Dear trader,
I know that many of you follow the stock markets as well as the currencies. Using Elliott Wave Theory as our basis for forecasting probable moves in the markets, we may be on the edge of a collapse in the US stock markets. The risk at this point is certainly to the downside and we want to get the word out to as many people as possible. All across the globe we are seeing economies overheating and stock markets making new highs. The global flow of easy money has created a credit bubble of biblical proportions. To help people understand where we may be in the market cycle we've written an eBook titled 'It Has to Go Up, Doesn't It? - A Crash Prep Forecast for the Coming Market Collapse' In addition we've also created a new web site Crash Prep at http://www.crashprep.com/ The goal of this web site is to help you survive and prosper during the coming economic crisis.
You can download the eBook directly from:
http://www.crashprep.com/Portals/1/e...YCrashPrep.zip
Once you download the eBook you can view the sample that shows the table of contents and provides more details about the eBook. Best of all you can purchase the eBook directly from the eBook reader. We've priced it to be a bargain at only $9.95. This price is equal to a typical commission for a stock broker on the purchase or sale of 100 shares of stock. We've priced it low so as many people as possible can read this book and act quickly to protect themselves. If you know of others that would benefit from reading this eBook, you can mail the .zip file directly to them. We encourage everyone to protect themselves and not get caught blindsided like in 2000, but be prepared for the probable next leg of the down market.
Act fast, part of the book show just how quickly money can evaporate in a down market. We may be just around the corner from a market collapse, act while there is still time to prepare.
Greg Clark - Senior Technical Analyst
Elliott Exchange
http://www.elliottexchange.com/
http://www.crashprep.com/
__________________________________________________________
What happened the following day:
Dow Down 400 Points, Dollar Falls to 12M Low against Yen - Is This a Major Pivot Point into a Recession?
Tuesday, 27 February 2007 20:21:43 GMT
Previous Articles
Written by Kathy Lien, Chief Strategist
Over the past few years, the financial markets have become very speculative and highly leveraged. Today, we have seen the consequences of that aggressive risk appetite. On an intraday basis, the Dow hit a low of 12,086 which represents a drop of over 500 pips, and is the largest move that we have seen in at least 3 years. Risk appetite is plunging as investors bail out of nearly all assets. Even gold has not escaped the liquidation. Prices have fallen over $20 since yesterday’s close. The moves have been substantial and February 27, 2007 will either go down as a major historical turning point for the financial markets or an unparalleled buying opportunity.
The foreign exchange market has provided a great clue into what is behind this move. The Japanese Yen, which has long been the primary funding currency for a lot of these speculative investments has skyrocketed. The Yen is now trading at a 12 month high against the US dollar and is closing in on its year to date highs against many of the other major currencies. The 9 percent drop in the Chinese stock market is being quoted as the initial trigger for the drop, but the broadness of the liquidation suggests that we have just seen a major shift in investor risk appetite....
http://www.dailyfx.com/story/special...611317479.html
________________________________________________________________
US Dollar: Unwinding of Leveraged Bets Triggers Collapse in Financial Markets
Tuesday, 27 February 2007 22:05:16 GMT
Written by Kathy Lien, Chief Strategist
·US Dollar – Unwinding of Leveraged Bets Triggers Collapse in Financial Markets
·Hawkish Comments and Faster Money Supply Growth Contributes to Euro Rise
·Japanese Yen Earns the Title of Being the Day’s Best Performing Currency Pair
US Dollar - The financial markets have taken a blood bath today with the Dow plunging over 400 points and the dollar hitting a 1 year low against the Japanese Yen. Risk appetite is plunging as investors bail out of nearly all assets. The moves have been very substantial and February 27, 2007 will either go down as a major historical turning point for the financial markets or an unparalleled buying opportunity. To read more about whether this is a major pivot point into a recession, read our Special Report on DailyFX.com.
Having been the primarily funding vehicle for a lot of these leveraged bets, the Japanese Yen was a great leading indicator for today’s move. The 9 percent drop in the Chinese stock market is being quoted as the initial trigger for the drop, but the broadness of the liquidation suggests that we have just seen a major shift in investor risk appetite. The moves today represent concerns about US growth. Durable goods orders dropped 7.8 percent in the month of January, which is the largest decline in 3 years. Excluding the volatile transportation component, orders fell by 3.1 percent. As we mentioned in yesterday’s Daily Fundamentals, the market’s reaction tends to be very volatile because of the underlying information provided by the ex transportation component. However by the end of the day, the headline number left a longer lasting reaction in the EUR/USD – and this was exactly what we saw today.
Even though consumer confidence hit a 5 year high and existing home sales increased by the largest amount in 2 years, the drop in durable goods orders was what mattered. As a component of GDP and a forward looking indicator for consumer consumption, the weak demand for big ticket items could trigger some concerns about the sustainability of the US recovery. The combination of low inflation, softer growth and problems in the sub-prime lending market will make it difficult for the Federal Reserve to raise interest rates again this year. Both the Financial Times and the Wall Street Journal have extensive coverage about the problems in the sub prime mortgage market today. According to the WSJ, banks are holding the lowest level of reserves to cover bad loans since 1990. With approximately $600 billion more adjustable rate mortgages to be reset to a higher market rate this year, two thirds of which are sub-prime, the risks for delinquencies and foreclosures are substantial.
The market’s risk aversion is so high right not that even if tomorrow’s GDP, Chicago PMI or new home sales figures surprise to the upside, it may only have limited impact on the dollar....
http://www.dailyfx.com/story/dailyfx...617524237.html
Stocks had their worst day of trading since the Sept. 11, 2001, terrorist attacks Tuesday, hurtling the Dow Jones industrials down more than 400 points on a worldwide tide of concern that the U.S. and Chinese economies are stumbling and that share prices have become overinflated.
The steepness of the market's drop, as well as its global breadth, signaled a possible correction after a long period of stable and steadily rising stock markets that had not been shaken by such a volatile day of trading in several years.
The repercussions continued Wednesday in morning trading in Asia. Shares in Tokyo, Hong Kong, Australia, New Zealand, the Philippines and Indonesia all tumbled more than 3 percent. The region's biggest bourse, the Tokyo Stock Exchange, saw its Nikkei 225 stock index fall 644.85 points, or 3.56 percent, to 17,475.07 points.
Hong Kong's Hang Seng Index dropped 3.8 percent, or 759 points, to 19289.30 after opening. Australia's benchmark S&P/ASX200 index shed 206.9 points, or 3.45 percent, to 5,786.9, while New Zealand's market fell more than 3 percent.
It began with a 9 percent slide in Chinese stocks Tuesday, which came a day after investors sent Shanghai's benchmark index to a record high close, setting the tone for U.S. trading. The Dow began the day falling sharply, and the decline accelerated throughout the course of the session before stocks took a huge plunge in late afternoon as computer-driven sell programs kicked in, and also as a computer glitch caused a delay in the recording of a large number of trades.
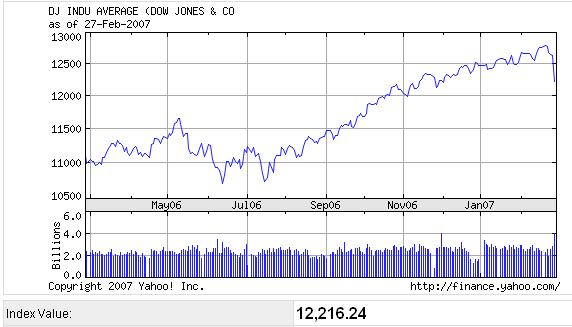
The Dow fell 546.20, or 4.3 percent, to 12,086.06 before recovering some ground in the last hour of trading to close down 416.02, or 3.29 percent, at 12,216.24, leaving it in negative territory for the year. Because the worst of the plunge took place after 2:30 p.m., the New York Stock Exchange's trading limits, designed to halt such precipitous moves, were not activated.
It was the Dow's worst point decline since Sept. 17, 2001, the first trading day after the terror attacks, when the blue chips fell 684.81, or 7.13 percent. In percentage terms, it was the biggest decline since March 24, 2003, when the index fell 3.6 percent as investors started getting rattled as U.S. casualties mounted in the early days after the invasion of Iraq.
The drop hit every sector across the market, and a total of $632 billion was lost in total in U.S. stocks on Tuesday, according to Standard & Poor's Corp. Riskier issues such as small-cap and technology stocks suffered some of the biggest declines, but big industrial companies, those that are often hurt the most in an economic downturn, also were pummeled, with raw materials producers among the hardest hit.
But analysts who have been expecting a pullback after a huge rally that began last October and sent the Dow to a series of record highs, were unfazed by Tuesday's drop.
"This corrective consolidation phase isn't just going to be one day, but we don't believe this is going to be a bear market," said Bob Doll, BlackRock's global chief investment officer of equities.
Some investors also tried to put Tuesday's slide into a longer-term perspective.
"All who invest should feel grateful that we've had a great run for the last 12 to 18 months," said Joel Kleinman, a Washington, D.C. attorney, adding that he has learned to not read too much into any short-term ups and downs. "This is another day in the market."
Still, traders' dwindling confidence was knocked down further by data showing that the economy may be decelerating more than anticipated. A Commerce Department report that orders for durable goods in January dropped by the largest amount in three months exacerbated jitters about the direction of the U.S. economy, just a day after former Federal Reserve Chairman Alan Greenspan said the United States may be headed for a recession.
"It looks more and more like the economy is a slow growth economy," said Michael Strauss, chief economist at Commonfund. "Moderate economic growth is good — an abrupt stop in economic growth scares people."
The market had been expecting the government on Wednesday to revise its estimate of fourth-quarter GDP growth down to an annual rate of about 2.3 percent from an initial forecast of 3.5 percent, and grew increasingly nervous on Tuesday that the figure could come in even lower.
The housing market, which the Street had been hoping had bottomed out, also looked far from recovery after a Standard & Poor's index indicated that single-family home prices across the nation were flat in December. A later report from the National Association of Realtors said existing home sales climbed in January by the largest amount in two years, but the data didn't erase housing-related concerns, as median home prices fell for a sixth straight month.
But a growing feeling that Wall Street, which has had a big run-up since October, was due for a correction also played into Tuesday's decline.
"I think that the market was prepared to pull back. The constellation of issues that were worrying the market came to a head," said Quincy Krosby, chief investment strategist at The Hartford.
Still, the market will need to pull back further before its decline can officially be called a correction, which is considered a 10 percent decline in a bull market. Just a week ago, the Dow had reached new closing and trading highs, rising as high as 12,795.92; it's now down 4.5 percent from that level.
The Dow's decline accelerated at a faster than normal pace during the afternoon after a computer glitch kept some trades from being immediately reflected in the index of 30 blue chip stocks. Dow Jones & Co., the media company which manages the flagship index, said the problem occurred after it was discovered computers were not properly calculating trades, prompting a switch to a backup computer.
The result was a massive plunge in the average in the seconds it took Dow Jones to switch to its secondary computers.
The broader Standard & Poor's 500 index fell 50.33, or 3.47 percent, Tuesday to 1,399.04, and the tech-dominated Nasdaq composite index was off 96.66, or 3.86 percent, at 2,407.86. Both indexes have also turned negative for the year.
The Russell 2000 index of smaller companies dropped 31.03, or 3.77 percent, to 792.66.
A suicide bomber attack on the main U.S. military base in Afghanistan where Vice President Dick Cheney was visiting also rattled the market Tuesday.
China's stock market plummeted from record highs as investors took profits when concerns arose that the Chinese government may try to temper its ballooning economy by raising interest rates again or reducing more of the money available for lending.
"Corrections usually happen because of a catalyst, and this may be it," said Ed Peters, chief investment officer at PanAgora Asset Management. "The move in China was a surprise, and when a major market has a shock it ripples through the rest of the market. With all the trade that goes on with China, there tends to be a knee-jerk reaction with that kind of drop."
The Shanghai Composite Index tumbled 8.8 percent to close at 2,771.79, its biggest decline since it fell 8.9 percent on Feb. 18, 1997. Since Chinese share prices doubled last year as investors poured money into the market after the completion of shareholding reforms, trading in Shanghai has been very volatile.
Hong Kong's benchmark Hang Seng Index dropped 1.8 percent, and Malaysia's Kuala Lumpur Composite Index fell 2.8 percent. Japan's Nikkei stock average fell a more moderate 0.52 percent, but European markets were rattled — Britain's FTSE 100 lost 2.31 percent, Germany's DAX index dropped 2.96 percent, and France's CAC-40 fell 3.02 percent.
Bond prices shot higher as investors bought into the safe-haven Treasury market, pushing the yield on the benchmark 10-year Treasury briefly note down to 4.47 percent, its lowest level so far this year, from 4.63 percent late Monday; the yield settled at 4.52 percent.
The durable goods drop raised the chance of the Federal Reserve easing interest rates later in the year — a possibility that makes the bond market an attractive place to be right now.
The hope for slowing inflation could be dashed, though, if energy costs keep rising. Oil prices initially fell Tuesday on worries that Chinese demand could be dampened should its economy slow down, but later rose on escalating tensions in the Middle East. Light, sweet crude for April delivery added 7 cents to settle at $61.46 a barrel on the New York Mercantile Exchange.
The dollar slipped against other major currencies, while gold also fell.
The Dow has been climbing at a steady rate since last summer, but over the past few trading sessions, stocks began pulling back on the worry that the market is due for a correction.
Data indicating a slower economy had recently been giving stocks a boost on the hopes that the Fed will lower interest rates, which could reinvigorate consumer spending and the struggling housing market. But the market may fall further before that happens, analysts said.
"If in a week or two, the psychology in the U.S. market turns to the realization that we're in a modest growth economy of 2 to 3 percent growth, that will help temper inflation pressures going forward. If that perception evolves, there's an increase in the likelihood that the Fed will be lowering rates rather than raising rates. Structurally, it's a development that should be good for the equity market, but it might be an event that unfolds after prices are lower," Strauss said.
Declining issues outnumbered advancers by about 7 to 1 on the New York Stock Exchange, where consolidated volume came to 4.56 billion shares, up sharply from 2.82 billion Monday.
__________________________________________
European Stocks Extend Global Slump; BHP, Rio Tinto Decline
By Sarah Jones
Feb. 28 (Bloomberg) -- European stocks headed for the biggest two-day decline in 4 1/2 years, extending a slump in global equities that has wiped almost $1 trillion off the value of world benchmarks.
BHP Billiton, Rio Tinto Group and Credit Suisse Group extended their slide after a sell-off in the Chinese market pushed U.S. stocks to their biggest rout in four years yesterday. Asian stocks fell the most in more than eight months today.
``It's not pretty,'' said Andrew Popper, chief investment officer at SG Hambros in London, who helps manage the equivalent of $13.7 billion. ``The Chinese stock market certainly shouldn't dictate direction so the fact is markets were looking for an excuse. We were due a correction.''
The Dow Jones Stoxx 600 Index dropped 1.8 percent to 363.75 as of 9:28 a.m. in London. The measure is set for the biggest two-day loss since 2002. The Stoxx 50 fell 1.6 percent and the Euro Stoxx 50, a measure for the 13 nations sharing the euro, slid 1.6 percent.
A global slide started in China amid concern the government of the fastest-growing major economy will tighten controls on investment. Declines were accentuated as U.S. economic data pointed to slowing growth in the biggest economy.
The Stoxx 600 Index fell 3 percent yesterday, the biggest decline since May 2003. The drop erased $360 billion in value off the benchmark. U.S. stocks wiped out about $600 billion in market value and erased all of 2007's gains.
`Correction'
Asian markets today extended the slump, wiping at least $280 billion off the region's equities.
National benchmarks slid in all 17 western European markets that were open. France's CAC 40 dropped 1.5 percent as did the U.K.'s FTSE 100. Germany's DAX slid 1.6 percent.
``This correction will probably continue for at least another two to three weeks,'' said Bob Parker, a London-based deputy chairman of Credit Suisse Asset Management, which oversees $502 billion. ``I don't see a strong catalyst to turn the market around. It is way too premature to say now is the opportunity to come back and buy the market.''
Shares of BHP Billiton, the world's largest mining company, dropped 3 percent to 1020 pence. Rio Tinto, the third-biggest mining company, lost 2.3 percent to 2736 pence.
Copper in Shanghai fell by as much as 2.9 percent after China's stock market plunged and amid concern about the U.S. economy, sparking speculation that demand may weaken in the world's two biggest consumers of the metal. The metal fell in London, leading aluminum, zinc, lead and nickel lower.
The Stoxx 600 reached its highest in more than six-years last week amid speculation earning growth and increased takeovers would help extend a four-year rally in markets.
`Very Healthy'
``This type of correction is very healthy,'' said Andreas Utermann, who oversees $1.5 trillion as the London-based global chief investment officer at AllianzGI. ``Once we see signs of stabilization, it will be a great buying opportunity.''
Credit Suisse, Switzerland's second-biggest bank, lost 2.8 percent to 84.7 Swiss francs. The company's income from equities trading jumped 57 percent in the fourth quarter.
UBS AG, Europe's biggest bank by assets, slipped 1.8 percent to 71.3 euros. Deutsche Bank AG, Germany's biggest bank, retreated 2.6 percent to 99.96 euros.
Munich Re slid 1.5 percent to 122.50 euros. The world's second-largest reinsurer, said fourth-quarter profit declined 52 percent to 641 million euros ($846.4 million) from a year earlier when asset sales boosted earnings. That missed the 655 million- euro median estimate of 16 analysts surveyed by Bloomberg.
E.ON AG, Germany's biggest utility, slid 4.7 percent to 98.37 euros. Italy's Enel SpA bought almost 10 percent of Endesa SA for about 4.13 billion euros, threatening E.ON's takeover of the Spanish power company.
Enel, HBOS
Enel bought 105.8 million shares in Endesa for 39 euros apiece. Shares of Enel lost 3.1 percent to 7.87 euros.
``Sentiment appears to be the main driver of the market at the moment,'' said Ed Wallace, who helps manage $2 billion in global equities at Gartmore Investment Management in London. ``Little has changed with economic fundamentals.''
HBOS Plc slid 4.3 percent to 1184 pence. Britain's biggest mortgage lender posted a 26 percent gain in second-half profit and said lending margins may decline in 2007.
``We anticipate some further margin decline in 2007'' due to competition in retail banking and mortgage lending, Chief Executive Officer Andy Hornby said in a statement.
Bouygues SA, the world's second-biggest construction company, slipped 1.4 percent to 52.05 euros, even as the company reported a 76 percent jump in fourth-quarter profit to 323 million euros. Full-year profit at Paris-based Bouygues was 1.25 billion euros. Analysts had expected 1.15 billion euros.
To contact the reporter on this story: Sarah Jones in London at [email protected] ;
Attached Image
- Joined Aug 2005 | Status: Member | 2,217 Posts
2/27/2007 4:51:41 PM
Stock markets across the world ended lower today, Tuesday, February 27, 2007
by Alan Hall
I took a Field Biology course one summer in college that gave me a new appreciation for both time spent with my girlfriend in fields searching for wildflowers, and the diligent observation required to identify plants by analyzing their structure. There was a lot of vocabulary to learn -- wonderful Latin adjectives mostly -- like glabrous, scapose, hirsute, senilis, and gemmiflorous. But the hard part was the careful, methodical, objective observation and comparison needed to identify beautiful flowers. After that idyllic summer, I gave up my English major.
Reading through Bob Prechter's Beautiful Pictures recently, I realized there are similarities between the botanical techniques of plant identification and the analysis of patterns in stock market charts. After all, they are both natural fractal forms that grow and develop within a system, one system, governed by Fibonacci mathematics.
You don't just read Beautiful Pictures. You have to study it, much like botany. It's a series of illustrations of Fibonacci time and price relationships in the Dow and S&P between the low in 1933, and the peak in 2000. One after another, the pictures gradually dispel any notion of coincidence in the precise development of these forms, until finally the "Aha" moment comes, and you understand their natural beauty of form, and glimpse the laws that govern them.
Uncannily accurate phi relationships exist between time durations of different waves of the same degree. It is hard to believe the price and time relationships between the two fifth waves of different degree -- from 1933, and from 1982. Phi is found again and again in price multiples between waves of the same degree, and in waves of different degree.
In the same way you can learn to identify hardwood trees in winter by their shape, you begin to understand that with study, market patterns can be just as visible.
They were certainly visible to Bob Prechter last week when he published the Elliott Wave Theorist Interim Report. In it, he used the same methods from Beautiful Pictures to identify in advance, a critical point in the growth process of the markets, one that has obviously and "unexpectedly" sent a shiver of fear up the spine of financial markets across the planet today.
Tomorrow you can read the list of the usual suspects; the explanations will be trotted out in a lineup by the media -- Greenspan, durable goods orders, concern that U.S. and Chinese economies are cooling, or the price of oil… changed. Does that after the fact "analysis" help you? Has it ever?
What was today? What did that global wave of selling represent? What happens next?
The Elliott Wave Financial Forecast will be published on Friday, and a very important support level for the Dow was clearly identified in the recent Theorist Interim. If you haven't read that yet, I suggest you do. Then it's time to hit the books if you want to understand the landscape. Conquer the Crash will provide the big picture and the strategy you need to deal with the changing season.
There are pretty flowers out in the fields, but there is also poison ivy, and occasionally, that one really bad mushroom… Know the landscape.
http://www.elliottwave.com/features/...d=2913*time=pm
- Joined Aug 2005 | Status: Member | 2,217 Posts
Global Markets: The Eerie Silence
2/27/2007 11:22:29 AM
2/27/2007 11:22:29 AM
*****
Watch financial news these days, and you can't escape the feeling that the world economy is in a pretty good shape. Maybe that's why the financial markets seem anything but nervous. Here are some facts about their rare, unanimous nonchalance:- The Chicago Board Options Exchange’s VIX index, a popular measure of the stock market volatility, hit an all-time low in mid-November.
- Late last year, the market strategists at Wall Street’s 12 largest firms were unanimous in their views for an up market in 2007. European investors' confidence is also flying high. And it's not just the Europeans: The historically low short-term volatility readings of "more than 150 global financial assets" suggest "complacency towards risk is a global phenomenon."
- "In the credit market, the Dow Jones US CDX indices, which measure the spread investors pay for investment-grade debt, have dropped to historical lows in recent weeks" (The Financial Times). That's despite that fact that the U.S. bond market "is signaling a sharp slowdown" via the inverted yield curve.
- Also in bonds, "The extra yields, (or 'spreads') that investors receive for buying risky paper such as emerging market debt and 'junk' corporate bonds are all at or near historically lows." In other words, risky paper is no longer "risky."
- Since the start of 2006, the MOVE index, a bond market volatility measure (similar to the VIX index) has registered the longest period of low volatility since Merrill Lynch started the index in 1988, showing the bond market's extraordinary complacency.
- In the forex markets, the European Central Bank’s "'global hazard indicator,' which measures the implied volatility of currency trading, fell to an all-time low in November.
- Even the International Monetary Fund now thinks that presently, “The challenge is not to stave off imminent risks, but to take advantage of the benign environment.”
Bottom line, investors and regulators see nothing but blue skies ahead. Where does this confidence come from? Let's try and trace its origin.
You'll probably agree that investor confidence is a product of their perception of reality. If you see the glass as half-full, you are confident about the future of your investments, too. The Elliott Wave Principle teaches that our perception of the world is a product of our collective mood. In turn, our collective mood is reflected in the stock market prices – the best indicator of social mood we know. And since global stocks have rallied for 4 straight years now, indicating rising levels of investor optimism, the current "global economic complacency" is only logical.
But here's what's interesting. If you look back at other periods of similar calm in the markets, you will notice that, for example:
- The last time there was bullish unanimity among Wall Street analysts was 5 years ago, moving into 2001. If you recall, that year saw the S&P decline 13%.
- The MOVE index, which measures the bond market volatility, spiked below current levels only twice before. The first occurred in December 1989, at the forefront of the S&L crisis and a significant real estate decline. The other was August 1998, during a worldwide collapse in which investors took flight from low-grade debt. Both periods were also accompanied by an inverted yield curve, which is in place now.
True, it may indeed be "different this time around." But if history is any guide, every quiet ends with a storm…
(P.S. – Last night, while the U.S. was still asleep, China's stocks dropped 9.2%. And as we write this column, the DJIA is down 140 points and the U.S dollar is also taking a beating.)
http://www.elliottwave.com/features/default.aspx?cat=emw*aid=2912*time=am
- Joined Mar 2006 | Status: Trade the reaction not the news! | 10,243 Posts
Looks to me they didn't have enough time to get people for $9.95
- Joined Aug 2005 | Status: Member | 2,217 Posts
- Joined Aug 2005 | Status: Member | 2,217 Posts
By Vadim Pokhlebkin
Tuesday's (Feb. 27) 500+ drop in the Dow overshadowed another U.S. market that took a beating that day: the dollar, which lost almost 100 pips to the euro. Granted, that wasn't nearly as bad a black eye as the Dow's, but still notable.The sell-off in the USD was blamed on the soft durable goods numbers released Tuesday morning. True, durables came in weaker than expected, but the forex media overlooked one important fact. The EUR/USD rally started in the overnight trading and was almost over by the time the durables report came out. In fact, shortly after, the dollar took the upper hand and the EUR/USD turned south. The dollar's rebound was hardly logical given the weak durables and Tuesday's devastation in U.S. stocks…but who said forex markets are logical? They are emotional. By definition, emotion defies logic, which explains why the markets do the odd things they do.
Interestingly, traders' emotions are reflected in currency charts in the form of Elliott wave patterns. The number of those patterns is fixed: thirteen. Which means that if you correctly identify the part of a pattern you're in, you can forecast what part comes next. That's how our Currency Specialty Service analysts were able to make this forecast Monday evening (Feb. 26):
Update For: Tuesday
Posted On: Mon, 26 Feb 2007 19:54:00 GMT
EURUSD [Last Price]: 1.3185 [Topping, down] Allow for a new high above 1.3199 to complete the sequence from 1.3082, if not the entire rise from 1.2868. At least a correction would follow…
http://www.elliottwave.com/images/ez...02-13-07-1.gif
As you can see from this chart, we're been tracking an A-B-C move in the EUR/USD. Wave C always has five internal waves, but on Monday night we could only count four. A fifth wave rally was due, and we got it in Tuesday's overnight session. But a fifth wave is always a terminal move in the wave sequence, so a pullback was due next – and the EUR/USD indeed turned lower mid-day on Tuesday.
Now, how's that for a logical explanation?
- Joined Mar 2006 | Status: Trade the reaction not the news! | 10,243 Posts
DislikedCynical. Are you implying that charging for financial advise is unethical? Are you some kind of philosophical zealot or religious extremist that doesn't believe in commerce of any kind? Do you think the sponsors of this site don't generate any revenue from their services? I imagine that they are turning a very tidy profit from people sharing information for free here. But do you think they turn down all the advertising revenue and brokerage kick-backs? Not likely. Do you sneer at the sponsors of this forum also for charging the advertisers and other business partners for space on this forum? Do you eschew all commerce in your life, give away all your services for free, and never touch money? If not, then I detect gratuitous contempt and its corollary - naked hypocrisy, assuming that I understand the gist of your comment properly. If not, then I apologise and request that you please explain what you meant.Ignored
Here is mine, taking the following quote from a years worth of wisdom:
If you don't know where you're going, you will wind up somewhere else. - Yogi Berra
This is my sentiments exactly regarding Precter's version of EW. They have just about cornered the market on books, newsletters and seminars. Trading what they preach is a whole nother matter.
Everytime a new bull market begins they are readying themselves to call for a correction. Only problem is that they are sometimes years in advance.
Joe Granville once called the top and then years later was calling for another top which didn't happen. He was not able to regain his guru reputation. Somehow for whatever reason Precter has kept his following. To each his own.
- | Joined Feb 2006 | Status: Spartan Attitude | 1,500 Posts
Does anyone know of a program that will automate Elliot Wave drawings on chart? Maybe some type of auto pattern expert....
In Charts We Trust!
- Joined Aug 2005 | Status: Member | 2,217 Posts
DislikedYa know, I didn't deserve such a lengthly retort. "Are you some kind and ... Do you think ..."
Here is mine, taking the following quote from a years worth of wisdom:
If you don't know where you're going, you will wind up somewhere else. - Yogi Berra
This is my sentiments exactly regarding Prechter's version of EW. They have just about cornered the market on books, newsletters and seminars. Trading what they preach is a whole nother matter.
Everytime a new bull market begins they are readying themselves to call for a correction. Only problem is that they are sometimes years in advance.
Joe Granville once called the top and then years later was calling for another top which didn't happen. He was not able to regain his guru reputation. Somehow for whatever reason Prechter has kept his following. To each his own.Ignored
To reduce an entire science and two remarkable predictions to a bid to sell a book and other products is neither open minded, respectful, objective, or helpful. You are entitled to your cynical, sarcastic, prejudiced viewpoints, but don't be surprised if you receive reactions in kind. It is plain that you consider Elliotticians to be the modern equivalent of snake oil salesmen - cheisters and charlatans, bent only on deceiving people out of their hard earned money. ("They are hawking DVD's and books and have their "predictions" just like all the Elliott Wave crowd." ) You may be right, but pure, unsupported opinions of an absolutist and negative kind are not very helpful to someone who is actually open mindedly trying to determine the truth of a complex topic.
And if you believe that Elliott Wave Theory is pure bunk, and that all elliotticians are con men and women, then what are you doing commenting on this thread, which is devoted to explaining the theory? Trying to warn all the gullible marks? You might succeed better if you started a thread and tried to prove that Elliott Wave is a total waste of time, and that all sites that provide consultancy services, software, and signals employing that method of analysis are deliberately defrauding people. That goes for most of the major forex brokers, academies and portals, such as DailyFX.com , because in the past year Elliott Wave theory has become a dominant model for evaluating the forex market. In addition, FXCM has a partnership arrangement with Phincorp, who rely heavily on Elliott Wave theory.
The kind of remark that triggered this discussion isn't sanctioned on this site, because of the very nature of the discussion that these kinds of negative, uninformative comments generate, of which our dialogue is an example. It is both unpleasant and relatively valueless. If you had something substantive to say, or provided even a shred of reasoning or evidence to substantiate your sneering remark, then I would have appreciated it. But the next time I see a non-substantive, negative remark like yours on a thread, I won't reply with what I really think - I'll just alert the moderators.
In any case, thanks for your more reasoned response. I'm not convinced that all elliotticians are snake oil salesmen because one somewhere allegedly made an inaccurate prediction, or because they expect to be paid for the work they do - any more than I will dismiss all doctors because one made a false diagnosis, or because they don't all work for free.
Is any of this kind of discussion useful? I doubt it. That's why the owners of this site discourage it, and why so many people choose to visit this forum - because it isn't a place to argue, but rather to reason with goodwill and an open mind based on ideas and information, not to hammer each other with fixed opinions.
Suffice it to say that analysing financial markets to try to predict future movements is not an exact science. Many, many methods have been developed. Few, if any, are perfect. Elliott Wave theory is one model that many professionals employ. It is very complex and difficult, and not everyone has the persistence or aptitude to use it to any benefit. There are also various schools and styles of Elliott Wave theory, obviously some of which are better than others.
There are apparently some people who hold Elliott Wave Theory in very low regard, and for some reason, even contempt. Elliott Wave theory seems to be the theory that some adherents of the "Efficient Market Hypothesis" like to ridicule and condemn. Most, if not all of those people have not studied it adequately, or at all, and they haven't actually evaluated empirical evidence of its efficacy, or they hold it to standards of perfection that they don't apply to other systems of analysis. Perhaps they are jealous, competitive, or simply ignorant or ill-tempered. The theory does not deserve this degree of dismissive contempt. It is a theory with limits, but it can be amazingly accurate and helpful if one understands its limits and uses the knowledge it affords wisely.
- Joined Aug 2005 | Status: Member | 2,217 Posts
A few months ago, Cat Davey of Australia interviewed Glenn Neely (over the phone). Attached are excerpts from that interview.
Attached File(s)
- Joined Mar 2006 | Status: Trade the reaction not the news! | 10,243 Posts
You seem to think that I don't use EW. Wrong. I use it within its limitations. What do you think Mr Elliott would think of all these so-called experts?
I could go on and on but you are right - there are better things I could do with my time.
Now let see you give me another eighty paragraph response to mine in this Open Forum.
I could go on and on but you are right - there are better things I could do with my time.
Now let see you give me another eighty paragraph response to mine in this Open Forum.
- Joined Aug 2005 | Status: Member | 2,217 Posts
DislikedYou seem to think that I don't use EW. Wrong. I use it within its limitations. What do you think Mr Elliott would think of all these so-called experts?
I could go on and on but you are right - there are better things I could do with my time.
Now let see you give me another eighty paragraph response to mine in this Open Forum.Ignored
You made a derogatory comment on "all the Elliott Wave crowd" recently. So you obviously have a low opinion of all or most contemporary elliotticians. As someone who knows about the creator of Elliott Wave Theory - Mr Elliott, as well as contemporary elliotticians, and has a severe criticism of "all the Elliott Wave crowd" - perhaps you would take the time to define more precisely who "all the Elliott Wave crowd" are, and to elaborate on your criticisms so that we can at least get a general idea of where you feel "all the Elliott Wave crowd" has gone wrong. Is Glenn Neely also part of "all these so-called experts" who are causing Mr Elliott to turn in his grave?
- Joined Aug 2005 | Status: Member | 2,217 Posts
The consultancy service connected to ForexNews.com - AceTrader, also employs Elliott Wave analysis to make discreet market predictions (trade recommendations) for a fee, as do dozens and dozens of similar agencies:
About AceTrader
As the Internet operation arm of Trendsetter Financial Markets Limited, AceTrader provides 24-hour realtime forex trading recommendations and market commentaries to online traders through our website. These trading recommendations and market commentaries were originally available to institutional traders through Reuters network only. Now it's available to all individual online traders.
http://www.forexnews.com/external/ac.../tradedesk.jpg
We provide genuine real-time forex market commentaries and trading recommendations to both Reuters and Internet users. Led by world renowned technical analyst, Wilson Leung, we have a team of 7 analysts monitoring the market and updating our recommendations and commentaries 24 hours a day. Wilson Leung has over 20 years of experience in forex market. He is a regular speaker at Technical Analysis seminars all over the world and has conducted over 100 such seminars with Reuters for forex traders in Asia, Continental and Eastern Europe, Scandinavia, CIS and the Middle East.
Our key strengths are:
- Precise Recommendations
No-nonsense clear-cut recommendations that include specific entry, stop, target levels. - Full coverage of the market
As long as the market is open, we're there providing insights to you. - Real-time updates
Foreign exchange is a fast market, with real-time being the vital ingredient for success; analysis from an hour ago can sometimes become useless. - Multi time-frame recommendations
To profit from the market, one needs to know the short term, medium term and long term trend. Providing intra-day, daily, weekly and medium term analysis and recommendations is our unique feature.
KEY FEATURES OF ACETRADER:
Intra-day Strategies
- Up-to-the minute update around the clock
- Provide users with our views and recommendations at that moment
- A unique 20-30 pips range forecast for close monitoring of the intraday movements
- Aim at quick 30-45 pips profits trades throughout the day for intra-day traders
Daily Strategies
- Updated 3 times a day with interim up-to-the minute special updates
- Provide users with our views and recommendations at that moment
- Aim at 60 - 90 pips overnight trades for position traders
Sound Alert
- Sound alert is now available in AceTrader. You don't need to be 'glued' to the screen any more. Whenever there is a change in Strategy/Entry Level, Position, Objective or Stop-Loss, you'll hear a beep sound. You can focus on something else and check us out only when you hear the alert.
Weekly Strategies
- Updated every Monday to give a forecast and trading recommendations for the week.
- Specially designed for position traders looking for bigger moves of 100 points or more.
Medium Term Outlook
- Monthly forecast
- Gives an overall market overview of one month and slightly longer
Daily Technical Outlook
- Provides detailed analysis of USD/YEN, EUR/USD, USD/CHF and GBP/USD every day, highlighting important support and resistance levels, retracement and projection analysis, and technical indicators used in forming our trading recommendations.
- With this, you'll know what is likely to happen during the day and what to expect next when a certain support or resistance is broken.
Elliott Wave Analysis
- Bi-weekly detailed explanation of Elliott wave count of the selected major currencies
- Includes Larger Degree Wave Count
- Joined Aug 2005 | Status: Member | 2,217 Posts
By Vadim Pokhlebkin
The U.S. dollar has been losing to the euro all week. You know why: On Tuesday (Mar. 13), for example, it was the weak U.S. retail sales figures and concerns over U.S. subprime mortgages that apparently sent the EUR/USD higher.
Curiously, though, the bulk of the EUR/USD rallies this week have taken place in the overnight trading. On Monday (Mar. 12), the EURUSD gained 70 pips before the U.S. markets even opened. Similarly, on Tuesday the pair gained about 40 pips – half the Tuesday's rally – way before the U.S. retail numbers were released.
One could say that the European Central Bank's interest rates hike last Thursday is what lit the fire under the EUR/USD. Of course, the pair lost on Thursday and Friday of last week, after the ECB's hike...which doesn't really add up, and that's probably why analysts have "forgotten" about it.
Forex markets in general have a very short memory, wouldn't you say?
When the dollar finally rallies, the weak retail figures, the subprime lender troubles, the ECB's rate hike – all that will be forgotten, and analysts will likely focus on ways to rationalize the dollar's sudden strength.
And the USD may indeed get stronger from here. No, not because of the "fundamentals." As you can see, their influence has been questionable, and we don’t think much will change going forward. The reason we think the USD may get stronger...well, take a look at this chart:
http://www.elliottwave.com/images/ez...%203-14-07.gif
As you can see, all this week the EUR/USD has been rallying in a larger, corrective wave (b). Within this (b), a smaller wave c – which is always a 5-wave move itself – appears to be almost finished. In fact, Tuesday's push to $1.3219 may have completed the last, fifth wave of the entire sequence.
That's why an intraday update of Elliott Wave International's Currency Specialty Service said this Tuesday morning:
06:11 ET/10:11 GMT
[EURUSD] Last Price: 1.3169. ...one more push up to above 1.3199 is still needed to more cleanly finish five waves up from 1.3088. Price printing above 1.3178 would bolster this view, and this more preferably occurs over the coming hour or so...
The EUR/USD indeed "printed above $1.3178 within an hour or so" of that intraday forecast. Will the USD muster enough strength from here to change the recent trend? Stay tuned with our Currency Specialty Service.
- Joined Aug 2005 | Status: Member | 2,217 Posts
In the March 2, 2007 Elliott Wave Financial Forecast...
"The now infamous 'Big Glitch' ... began right at the 12,337 'bear confirmation' level from the February issue of EWFF. Market action validated our levels."
- March 2, The Elliott Wave Financial Forecast
"The now infamous 'Big Glitch' ... began right at the 12,337 'bear confirmation' level from the February issue of EWFF. Market action validated our levels."
- March 2, The Elliott Wave Financial Forecast
The Elliott Wave Financial Forecast and The Elliott Wave Theorist have recently commented on the extreme investor optimism and its foreshadowing of a drastic reversal. Then came Tuesday, Feb. 27, when the markets experienced not only a 3+ percentage downward thrust, but a fear-inducing reversal not seen on a daily degree since 2001. It was obvious that there would be more to the story.
Here's what Financial Forecast Service subscribers have been reading throughout the run up to Tuesday's aggressive reversal and the volatile price action since.
Feb. 2: The February issue of The Elliott Wave Financial Forecast said a break of 12,337 "returns us to an aggressive bearish stance."
Feb 21: Bob Prechter's urgent Feb. 21 interim issue of The Elliott Wave Theorist presents a narrow date range for a top: "... on Friday, February 23," with "a leeway of only ± 3 trading days." Bob states unequivocally, "Speculators should return to a fully leveraged short position immediately." That same day, Steve Hochberg's Short Term Update tells subscribers, "... coming under the wave 4 low (12,536.20) will be an early warning sign that the rally is complete."
Feb. 26: Steve posts a Short Term Update including a chart of the DJIA titled "Near the End of Wave (5)," which shows the index subdividing toward a top.
Feb. 27: Steve appears on CNBC's Power Lunch segment and then returns to his home office to observe the Dow's 400+ point sell off. Soon after the markets close, Steve publishes a chart in a special interim issue of Short Term Update calling for a relatively small bounce, followed by more declines.
Feb 28: Steve gives his wave count for the drop and states of his forecast, "... with such a wide consensus (of bulls and bulls in waiting), a complete Elliott wave pattern and with a market decline that was truly historic yesterday, we think the odds are on our side."
March 2: Steve and co-editor Pete Kendall release the March issue of The Elliott Wave Financial Forecast, which digs deeper, addressing exactly what happened on Feb. 27 and what is expected to happen in the U.S. and elsewhere in the near and intermediate future....