Attached Image (click to enlarge)
This is my summary of Patrick25's, Strat's and Blackeagles contributions to the USDCAD situation. I have done this for my own pratice in drawing TLs and chart reading. I hope you more experienced chaps don't mind me floating this to see if it's correct. How else am I to learn??
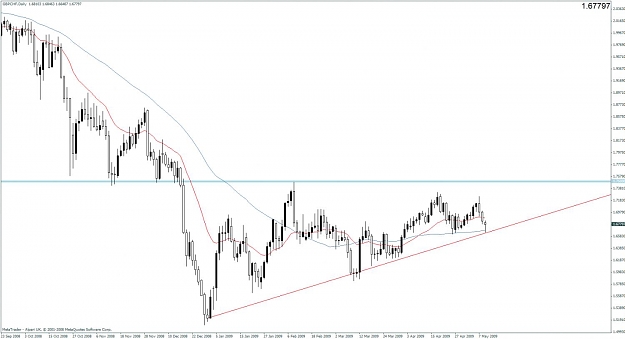
Big Boss down for the last three months.
Boss down for the last nine months except for a bond hammer on 22nd March.
Daily down approx to 38.2 Fib drawn from the major SL on7/11/07 with a BE (almost, short of 1 pip) EB on Friday last, 8/05 which was also support in Oct and Nov 2008. Price well below 20 and 50 MAs and Boss MAs (just broken through Boss 250)
Currently up today but still a way to go before closing the candle.
Looking for PA around the support of 1.15010 (38.2 Fib). If support is broken take trade with SL 1 pip above today’s candle with first TP of 1.11107, 2nd TP at 1.08910 (ish) at the extension of the long-term trend line from 6th Nov 2007. If that is broken then further falls to approx 1.02710 which has confluence with the 61.8 Fib.
I can’t assess the risk and therefore the trade size at the moment until candle closes tonight. But I would reduce trade size to take 1.% risk – if that was possible on my account size. If not I would not trade.
Attached Image (click to enlarge)