Joined Feb 2009
|
Status: 15 YEAR PASR THREAD Senior Member
|12,379 Posts
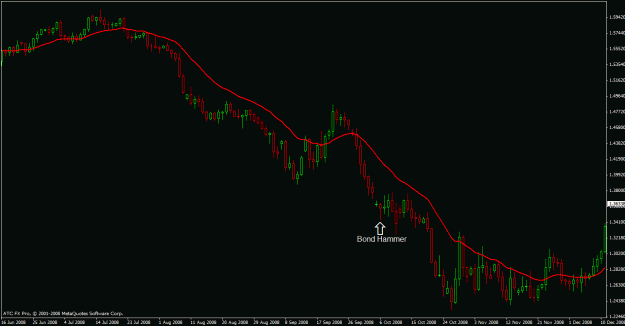
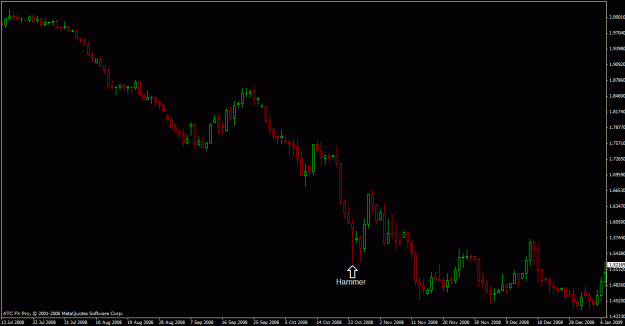
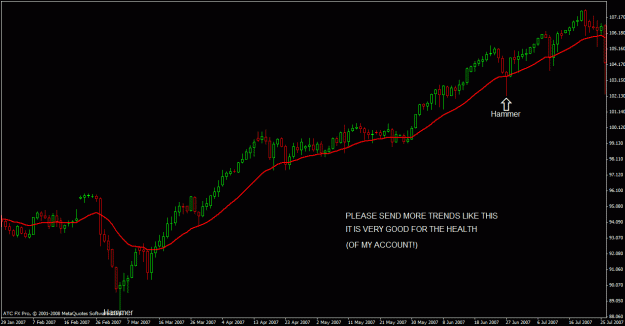
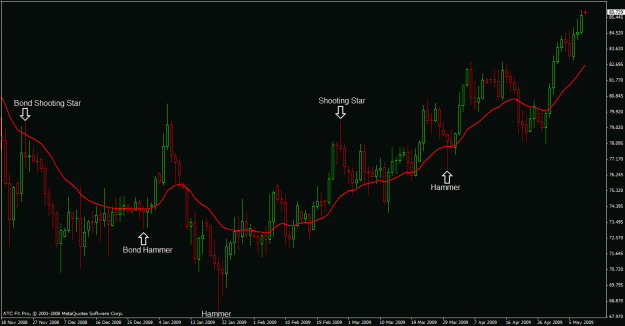
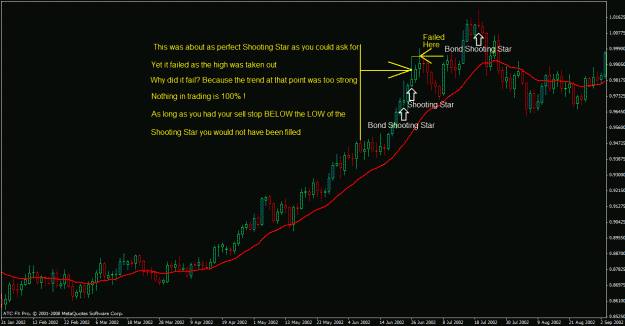
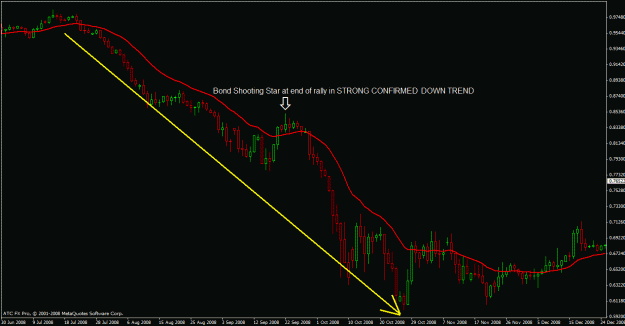
For those with different data who don't see the candles I saw, here are the charts for the hammers. I also saw some Bond stuff so identified those too.
http://www.forexfactory.com/images/icons/icon1.gifNo Pins on here, so Puppets and Muppets Please Leave!
I've been meaning to post this for ages and then something else comes up so after a PM this week-end, I finally got the memory jog.
Re-visiting the Hammer & Shooting Star Price Reversal Bars;
Ignored
Quoting Strat
Disliked
http://www.forexfactory.com/images/icons/icon1.gif Drawing TLs (Trend Lines) and a trade or two
Drawing TLs is VERY subjective, you can draw them any which way to suit your purpose (even conjure up a trade that isn't there - NOT RECOMMENDED!
Ignored
Hi Strat
Just wanted to add my thanks for your continued efforts in reiterating whats important in PASR. I've struggled with TLs in the past with them being very subjective to me. But in the future will put in more effort to try to draw them so that they "mean something to me".
Emphasizing and re-emphasizing these points is really helpful to all of us that are on "the path" and especially those of us that have just recently joined.
I am still plodding through the previous posts while keeping up with the new posts. Takes time for it all to sink in and to look at actually applying it all - which in the end is the real test.
GBPUSD and USDJPY were trading somewhat inverse to each other until around August 14, 2008 when USDJPY decided to "flip over" and trade WITH GBPUSD
Ignored
Mainly because of increased risk aversion and hence offloading carry trades. It is really difficult to trade when correlation is high. For some time, FX Market is correlated with Equity indices and whenever indices moves north, people assume risk appetite is back and sell USD, therefore, correct technical analysis of equity indices could generate a very decent return on FX markets recently, even if you don't look at any FX chart for major pairs (a little bit of exaggeration would do no harm). This means, if you are trading different pairs, actually you are increasing your risk in the same direction. That's why I hate correlation, too.
So, can it be the solution to trade crosses, even the exotic ones like EURNZD, AUDNZD, EURCAD or else for diversification? Why not?
Let's see if usdcad will find strong support at 1.1400 level, the trend line, and 61.8%.
Ignored
Well, Patrick, lad, if she doesn't hold at between where she is at now and 1.1400, we have a nice ride down to 1.0800 and if it goes, I, for one, will not miss it (this time).
Did you just zoom out your chart to get the S&R or do you always work zoomed out? If you do, how can you see your candles and PA?
Mainly because of increased risk aversion and hence offloading carry trades. It is really difficult to trade when correlation is high. For some time, FX Market is correlated with Equity indices and whenever indices moves north, people assume risk appetite is back and sell USD, therefore, correct technical analysis of equity indices could generate a very decent return on FX markets recently, even if you don't look at any FX chart for major pairs (a little bit of exaggeration would do no harm). This means, if you are trading different pairs, actually...
Ignored
Trading those crosses eliminates the $ and therefore the correlation with the equity indices BUT then brings in the gold (AUD) and crude (CAD) commodities correlation so it looks like there will be some correlation somewhere.
I'm not too keen on exotics as I don't like the spreads and more important the low volumes and liquidity (compared to the majors).
Just wanted to add my thanks for your continued efforts in reiterating whats important in PASR. I've struggled with TLs in the past with them being very subjective to me. But in the future will put in more effort to try to draw them so that they "mean something to me".
Emphasizing and re-emphasizing these points is really helpful to all of us that are on "the path" and especially those of us that have just recently joined.
I am still plodding through the previous posts while keeping up with the new posts. Takes time for it all to...
Ignored
Thanks for the appreciation, Greg. Take your time and keep READING, UNDERSTANDING and LEARNING.
Well, Patrick, lad, if she doesn't hold at between where she is at now and 1.1400, we have a nice ride down to 1.0800 and if it goes, I, for one, will not miss it (this time).
Did you just zoom out your chart to get the S&R or do you always work zoomed out? If you do, how can you see your candles and PA?
Ignored
oh, the chart is for display only. I of course zoom in for PA.
Thanks for the feed back.
Well, Patrick, lad, if she doesn't hold at between where she is at now and 1.1400, we have a nice ride down to 1.0800 and if it goes, I, for one, will not miss it (this time).
Ignored
1.0750 looks better, IMO, but before that there is 1.1000. The problem with these levels are 1.1000 served as support only in the past and 1.0750 served as resistance only, not both S & R. So, we should watch PA around these levels carefully. We have also LT TL support at 1.1000
Trading those crosses eliminates the $ and therefore the correlation with the equity indices BUT then brings in the gold (AUD) and crude (CAD) commodities correlation so it looks like there will be some correlation somewhere.
Ignored
100% agree. Re. spreads, since we are not scalping for 20-30 pips, I really don't care about them. But you are right about low volume and liquidity.
That account of drawing a TL and your interpretation of what was going to construct the candles was enormously helpful. I don't think it was spoon-feeding as it generates so many further questions which you left us to explore. When I read your interpretations they always seem so obvious in retrospect.
What I have to learn is how to do the same in real time - ahead of the action as it were. I can usually work out what happened in the past. It is making the correct decisions about where to draw the lines etc. AT THE TIME which is the really tricky bit! But I suppose making judgements about what is about to happen is the result of years of experience and something we new traders have to gather as quickly as possible through careful analysis and work on charts, and more charts and still more charts.
I have done a quick perusal of the thread and is now about 25% through my second more thorough read and digestion. I considered myself fortunate at this stage of my trading career in forex in landing myself on this thread.
Just a quick background of myself followed by my stage in forex.
I am 28 yrs old working in Singapore as a CPA accountant for 5 yrs. I started trading equity since I guess (cant rem exactly) 12 yrs old through my parent name HAHA. I love my job until I work like maybe 18 hrs per day. Of cos like most of people I assume I am young and can work near 24 yrs and will spend more time with my wife when I am rich (never happen...the more I earn, the more I work...). To cut the story short, we met an serious sporting accident and a few surgeries later we manage to see another day, yeah!
So taking a long leave to accompanied my now greatly appreciated wife, I decided to supplement my savings after watching it diminshed(okay, this part onwards will be similar to quite afew people). Obviously with some free time (my wife need time alone too HAHA), I need to do or learn something. One of the first is expanding my knowledge in valuation methods of equity and some other diversification method. One thing to another lead me to forex trading.
Now, come the part which more people may be interested in - my journey in forex. I started forex 13 wks ago on a demo account based on what I wanted to put in. The first account blew in about 2 hrs. It was just a nice game. I figure as long as I think the capital is immaterial, I will treat it like game. So I use a larger demo account (and imagine this is real money to be invested) and blew it in 1 week. During the that first 2 week, I catch up everything I could in babypips tutorial and various thread in forex factory.
Unfortunately, I started near the end of first week with threads offering quick scalping methods that required constant monitoring (being a hardworking worker, I of cos assume hard work equal more pips and I can monitor 24 hrs if required). With 10% return per month if you are good (base on some thread), I thought I can do with 5% per month man! I wired money to my broker and well you guys know that study of history may give you some indication of future (time to play the violin). By the end of third week, I blew 20% of account + due to lack of movement in trading whole day, I sort of damage my leg nerve and they loss all feelings....creepy to say the least. This two factors shock me out and I stopped trading. Instead I continue reading.
In the next 4 weeks (4 to 8 week of 13), I read other threads including Jacko and j16, leading me to clockwork (knowing sitting too long with no movement is dangeous, I now use a laptop and read while working out on a stationary bic in a gym). At the same time I read up on books such as Trading in the Zone, Mark Douglas, reminiscences of a stock operator, Edwin Lefevre
After finishing reading, I realise my error is afraid in losing, hardwork not equal to good result, lack of patience...thus my basic physcology is make for losing in market. This is business and I need a plan I realise.
My folly here is reinventing wheels despite what I have read. I tried to devise plan suitable for lower timeframe as what am I going to do in the whole day...I am not working gosh! Doing backtesting, I realise in a suitably long time frame almost all strategy become almost 50-50 (Which mean the plan is at least average actually as I have to over come the spread) but I have since realised backtest is never a good indicator. I have also concluded that I am back to square one if I have to trade whole day again ( our mind are like the resistant we draw on the chart...it keep coming back...we need to bulldoze through it conclusively-its hard). At least point, I am thinking of signing up with any signal service until i realise it is better to learn how to fish then be given the fish as the one giving can stop giving anytime.
I continue to read and found this thread (I am a nerd that like reading). After reading this thread through, there is sort of a confluence in serveral areas in my mind. I shall endeavour to summarise them below:
1. From trading in the zone -
a)Anything can happen in the market and trade with a plan and form no expectation on the market. This allow us to be nimble in cutting loss and identifying opportunities and not hang on till we die. As anything can happen, even a perfect set up can have losses. Thus we need to identify stop loss even before we trade.
b) We need to drop our old belief through exercise such as keeping a trading journal and to slowing build a new belief and channel energy into it from the old belief (I envy Dan and others here who is lucky enough to be school right at the start of the thread and respect you guys for having the determindation of keeping a journal which mark the growth of your thought process over time).
2. From reminiscences of a stock operator and Dr Joe, I realise the importance if identifying trend and the wisdom of buying high and selling higher. We must never stand in the way of the trend.
3. From J16, I gain some knowledge of PA which we all know is important in this thread. PA is the signpost which give us an slight edge in every trade we took that in many trade allow us to win (Like casino as per Douglas).
4. From clockwork, I have gain some knowledge in setting SR based on weekly charts and to trade based on PA when we are moving away from the SR zone. Obviously PASR is what Strat is trying to hammer into our head.
Based on above, I have tried to develop another plan(credit apart ofr Strat go to Dan and others who have develop checklist) which I will summarise below (Purpose is to gain critism and ensure understanding).
MM
i) Not to increase funding from my savings until I can break even my previous losses.
ii) To trade at most 2% of my existing balance and not take trade even with perfect set up if the require SL come out to >2%
Trade Entrance:-
i) Review the bosses to confirm long short trade. ( I review base on drawing tangent lines and to see the angular change from line to line)
ii) Review SR for price action. If it is a breakout of support to resistance, or vice versa to allow for one test to check for fade.
iii) Despite my knowledge in other continuance or reversal bars/candles to first stick to hammers and shooting stars PA.
iv) To cross check against MM to ensure the SL is within my acceptabe limits
Trade management:-
i) SL at important SR. Lossing at this early trading career is not too good for health. Thus once near a important SR, at first opportunity I will bring to slightly above BE. Once the hurdle at minor SR is over, I will update my SL accordingly.[I notice this area is quite subjectively from trade to trade.]
Trade exit:-
i)Again base on PASR, exit should be based on sign of reversal. (Here I am inclined to use my knowledge on other candle stick patterns)
Base on my plan above, I acknowledge my serious weakness in trade management and exit, as I cant even articulate the plan concisely to myself.
Now, obviously even with my knowlege and plan above, it does not matter one bits if I do not have the patience or discipline to do it. Strat method of teaching is like a strict instructor with his cold water and scarcastic remarks. The really make me afraid of him. When afraid I tend to do what make me afraid says. Whenever I wanted to trigger a trade out of itchy finger I feel someone is abt to scold me haha. I can ramble forever and I shall stop here !
Ps: I have emailed Lance to set me on the path. Thanks!
ii) To trade at most 2% of my existing balance and not take trade even with perfect set up if the require SL come out to >2%
Ignored
Why miss the perfect setup? Instead of not taking trade, you can adjust your trade size so that your predefined stoploss amount does not exceed 2% of your account balance.
Considering your trading experience, I suggest "no rush" in trading with real money. Even if you do, 2% per trade is too much as per your experience, IMO.
Joined Sep 2006
|
Status: Hors non numero nisi servitas
|795 Posts
If you wait for a confluence of price action on all time frames....as i do....there may be a situation when all the pairs are showing some sort of Daily action.
At this point you can select the best.
I have a max exposure of 9%(3 full line tickets) unlocked off in the market and as we are in a consolidation market i move very quickly to partial breakeven or profit depending on my target levels.Why? cause of the unharmony on the boss and big boss......thats why its consolidating.....no harmony in the heavens.
When we are trending....we have boss and big boss harmony so a daily price bar will perform better and correlations become more obvious....Q.E.D
Whats this got to do with correlation?...nothing as you should only trade YOUR CHART and then only the best, most perfect price bars.
Correlation will happen as you move forward and these correlations will uncouple too.
Like right now price is at "that point"....short USD......long Commodity curr........long carryish.....And they have all engageed to some degree there weekly price actions....It looks like recovery........swissy down,cable and fiber up.......CORRELATIONS galore.........
so what?......theres been no daily Price bars on my feed.I would rather have a hot brick placed sideways where the sun dont shine than actually fill a ticket in on some sort of cross correlation vibe.....
Im trying to imagine the justifcation in my head for doing so.......i think it would be like this:
"the almost BEOB on swissy..with an IB on cable means im longing fiber from that almost BUOB......plus the cad has only had bear bars but no price action but has broken that big support level.....the aussie is long and so is gold and oil........the carry is rebuilding but its only that USDYEN that banging its head off the 100 level.......so yes long EUROUSD...HUZZER!!
Why miss the perfect setup? Instead of not taking trade, you can adjust your trade size so that your predefined stoploss amount does not exceed 2% of your account balance.
Considering your trading experience, I suggest "no rush" in trading with real money. Even if you do, 2% per trade is too much as per your experience, IMO.
Ignored
I 100% agree with the Blackeagle.........no trading for you......just reading....welcome home......g
Hi Strat
I have read else where on this thread that it is very important that the candles on my charts correspond with the New York close. Is this the case as currently my charts close at midnight in the UK. I did not think it would make much difference as the 2 hours between New York close and Asian open is pretty quiet so there for not effecting the price action much and the key levels of support and resistence will still be the same.
Thanks Strat
I have finally entered my first trade. On Thursday a hammer closed on Eur/Aud off of the 1.7700 area. Price also seemed to be finding support on the original down trendline after it crossed above it on the 22nd of April. This area was significant in 2004, price could not close above it until 2008. Since the close above, price has been unable to close below it as of yet. NFP was on Friday as everyone knows, I looked at this hammer, thought about trading it. I decided against it because of the risk of NFP. The Friday bar closed 20ish pips above the hammer, so I took this trade off of the high of that bar. Stop still below the original hammer. The weekly bar closed as a bond hammer.The monthly is looking like a bond hammer as well, too early to tell how it will close though. But this area looked significant, so I took the trade with a little over 1/2% risk. Trade is at B/E plus a little, so I have a free trade, with slight profit, and it is still going up, albeit very slowly. First target is 1.8057 which is the 50% fib line of the initial down move, also a nice support resistance area and is roughly the area where the 20 is. If daily closes above this will lock in a bit more profit and ride it out,, this would also be a close above the 20 which would be a sign that price may go higher, aiming for 1.8328 which is the next significant S/R area I see. My initial take profit level makes this a decent reward to risk. Anyway, looks like my patience has finally been rewarded. I messed up on my entry, I forgot to take spread into account, so I got in lower than what I was expecting. I will have to remember this in the future. Altogether though this trade is stress free, especially now that I can not lose.
Hi Strat
I have read else where on this thread that it is very important that the candles on my charts correspond with the New York close. Is this the case as currently my charts close at midnight in the UK. I did not think it would make much difference as the 2 hours between New York close and Asian open is pretty quiet so there for not effecting the price action much and the key levels of support and resistence will still be the same.
Thanks Strat
Ignored
From a post earlier by blackeagle,
"I use IBFX and also a data vendor for my Metastock and other charting software. My trading is normally based on NY daily close data. But it doesn't matter which data you use, you should trade what you see. Because sometimes Alpari UK shows a shooting star whereas the very same bar is a normal bar on IBFX or vice versa. In the long run, they compensate each other, IMO."
I added the bold for emphasis. He basically stated, it does not matter, trade what YOU see on your charts.