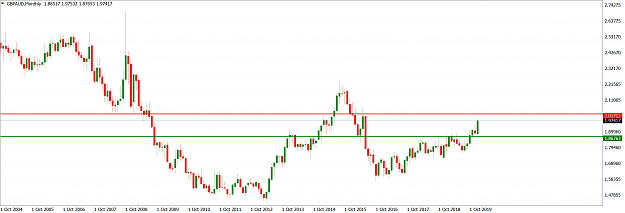
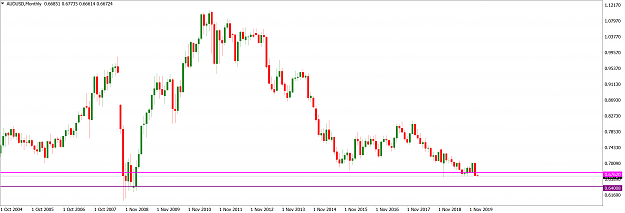
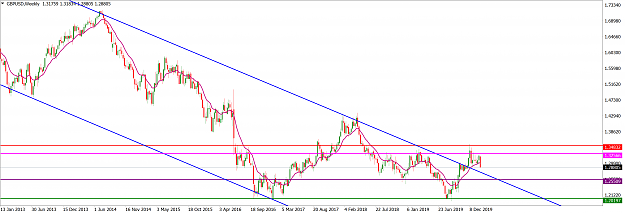
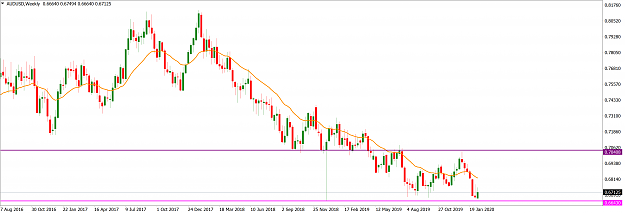
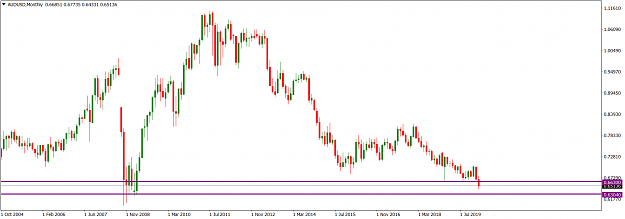
AUDUSD Weekly Technical Outlook
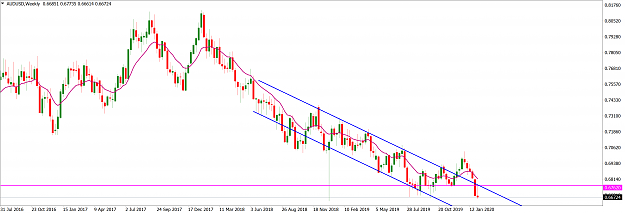
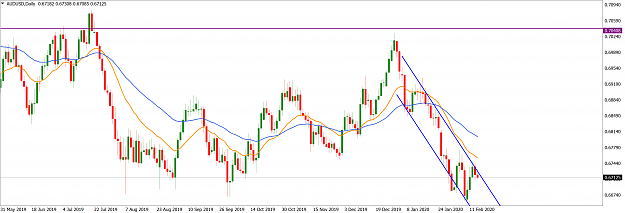
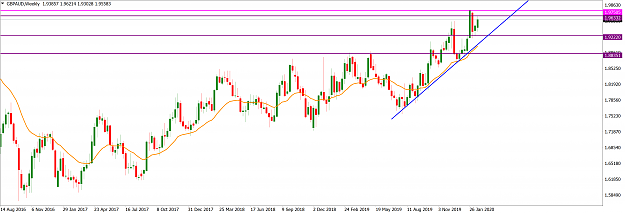
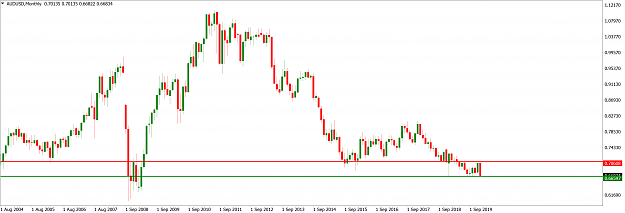
The AUDUSD market is generally disposed southward but has seen a period of consolidation since August 2019. On the monthly time frame, the 0.70610/0.66600 zone has served as a significant channel for market operation since May 2019. In January 2020, a bearish candlestick was printed from around the upper boundary of the channel and it nestled only a few pips shy of the lower boundary. We should expect some sideways or pullback of market operation in the 0.66600 area as it is a significant horizontal support.
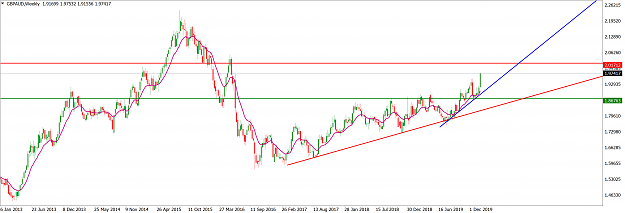
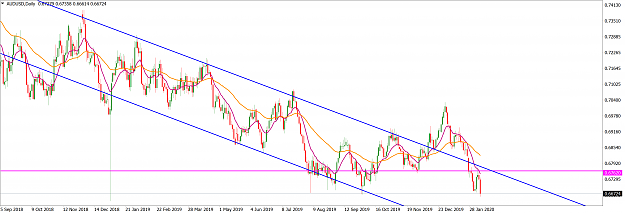
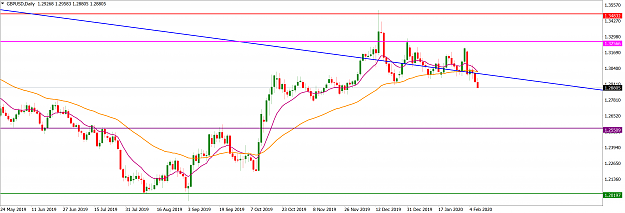
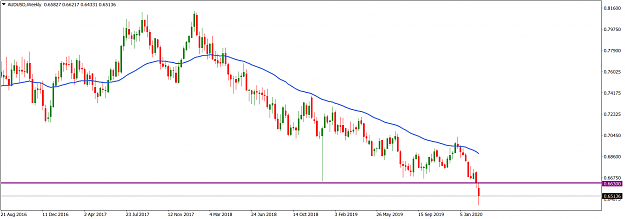
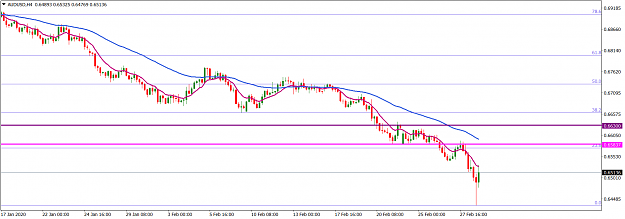
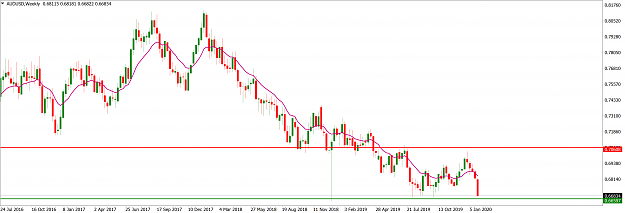
On the weekly time frame, price action was in a period of consolidation but recently has disposed southward. Last week, the market printed a relatively big bearish continuation candlestick. Presently, market operation is located a few pips above the 0.66600 horizontal support (green), which is significant on the monthly time frame, and we can expect a sideways or northward pullback of price action in the early part of this week.
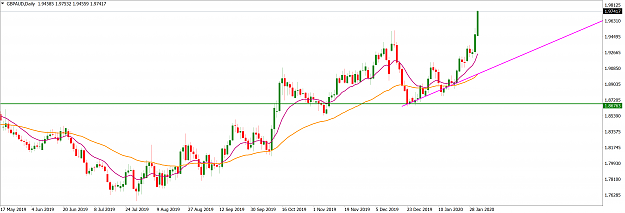
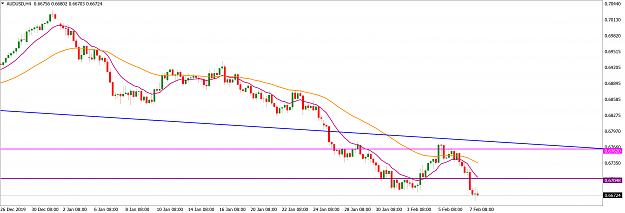
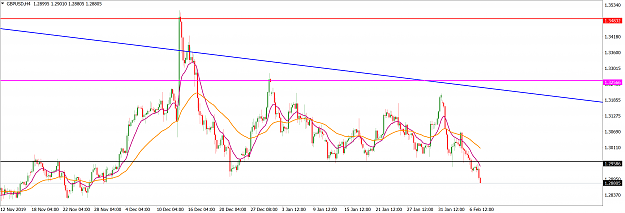
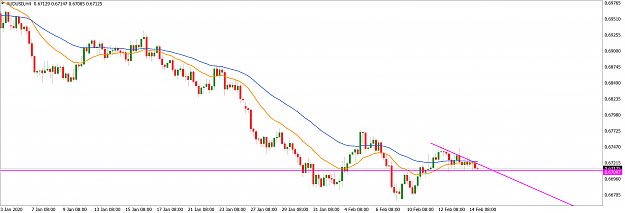
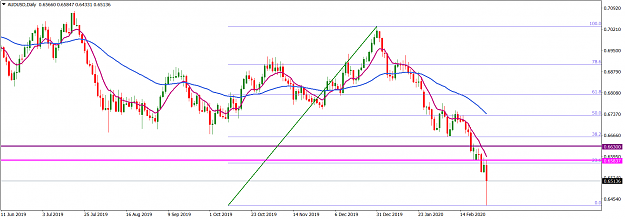
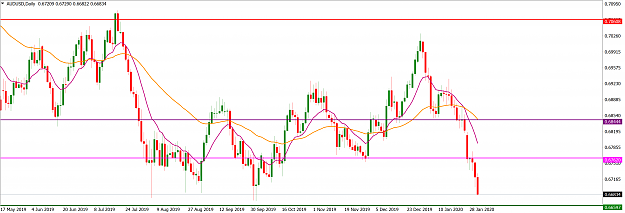
Recent price action on the daily time frame is bearish but is parabolic in nature; we can expect a northward pullback to an area of value in the early part of this week. An initial area we may expect price action to pull back to is the 0.67620 area (magenta). Should the area be breached northward, we may see the 0.68450 area (purple) exposed before a southward turnaround.
I may be wrong. Trade safe and prosper.
KP
The AUDUSD market is generally disposed southward but has seen a period of consolidation since August 2019. On the monthly time frame, the 0.70610/0.66600 zone has served as a significant channel for market operation since May 2019. In January 2020, a bearish candlestick was printed from around the upper boundary of the channel and it nestled only a few pips shy of the lower boundary. We should expect some sideways or pullback of market operation in the 0.66600 area as it is a significant horizontal support.
Attached Image (click to enlarge)
On the weekly time frame, price action was in a period of consolidation but recently has disposed southward. Last week, the market printed a relatively big bearish continuation candlestick. Presently, market operation is located a few pips above the 0.66600 horizontal support (green), which is significant on the monthly time frame, and we can expect a sideways or northward pullback of price action in the early part of this week.
Attached Image (click to enlarge)
Recent price action on the daily time frame is bearish but is parabolic in nature; we can expect a northward pullback to an area of value in the early part of this week. An initial area we may expect price action to pull back to is the 0.67620 area (magenta). Should the area be breached northward, we may see the 0.68450 area (purple) exposed before a southward turnaround.
Attached Image (click to enlarge)
I may be wrong. Trade safe and prosper.
KP
Do your homework, follow the footprints of smart money