GBPUSD Weekly Technical Outlook
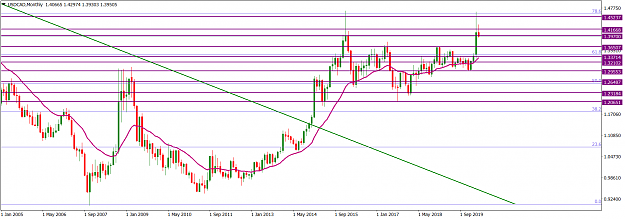
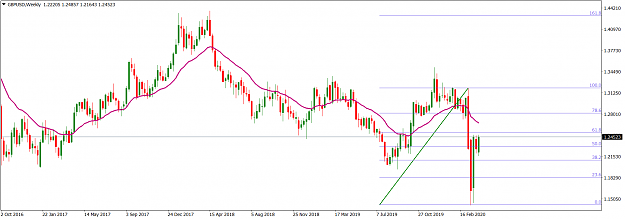
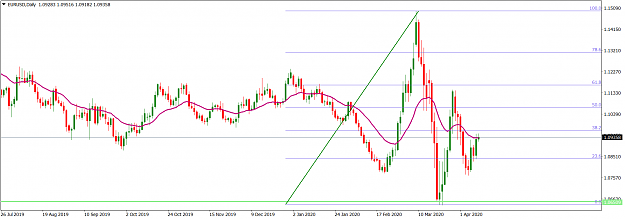
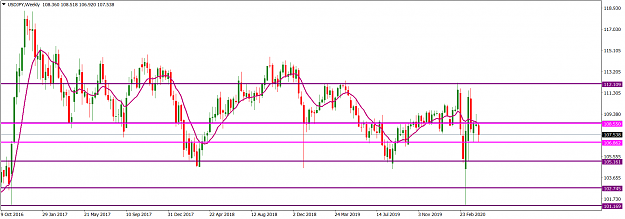
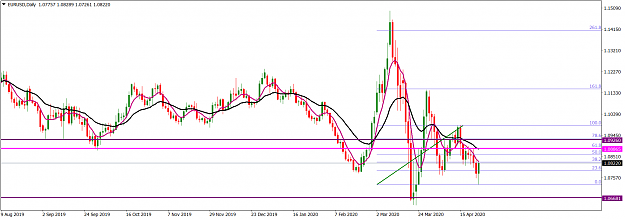
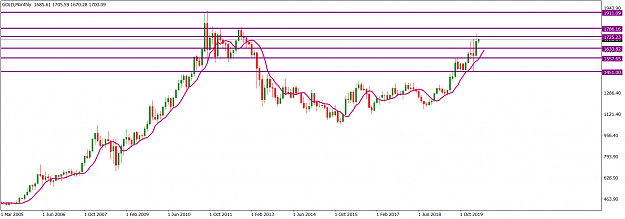
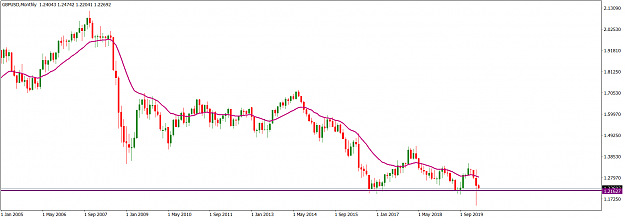
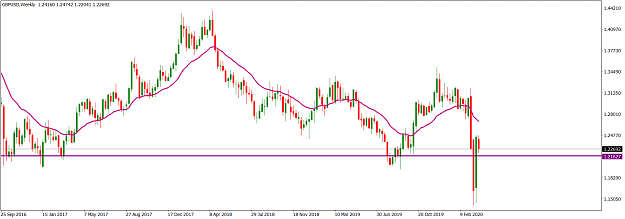
The bearish drop in March from the high of February produced an all-time low around 1.127250 before market operation retraced northward to the 1.24060 area. This was after it failed to break below the 1.21940 area, from where it rallied in October 2019. The March southward drive showed the intent of bears to maintain market control. Nevertheless, the long tail on the March print indicates that bulls are still influential. The 1.21630 area (purple) is the immediate horizontal support.
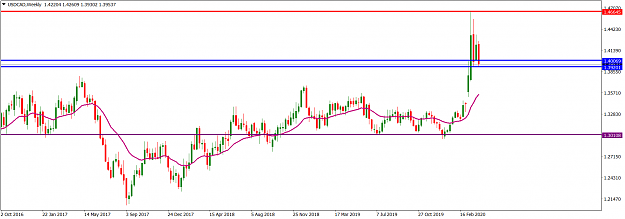
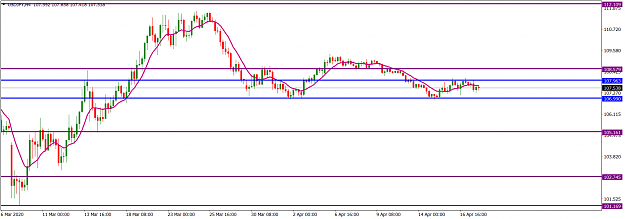
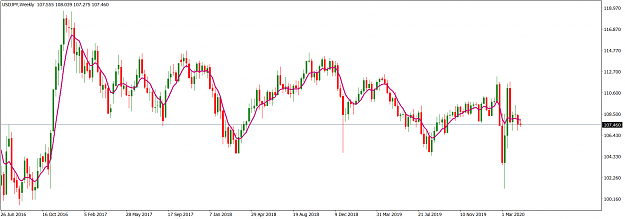
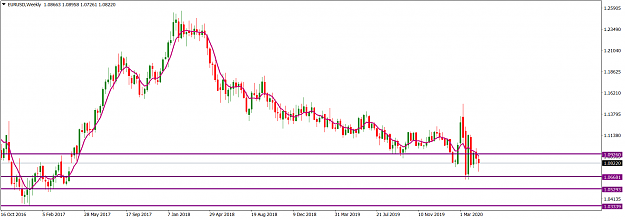
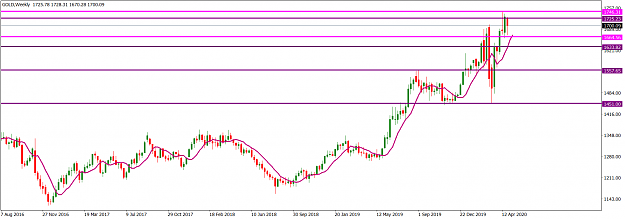
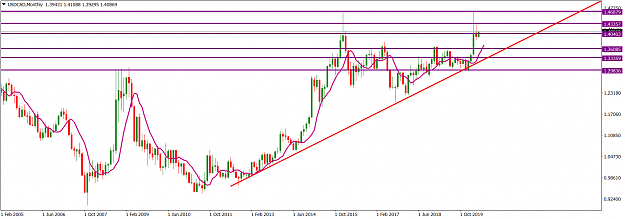
The weekly time frame presently shows a consolidating market operation. The strong bearish print of three weeks ago lacked a follow-through as it was countered by a strong bullish drive a week later. Last week’s candlestick print was a relatively smaller bearish candlestick that failed to break below the 1.22690 area, an area that had been a horizontal support since the second week of October 2019 before it was broken down three weeks ago. Apparently, any bearish drive to be sustainable will have to significantly break down the 1.22690 area. The next significant horizontal support zone is around 1.21630/1.19670.
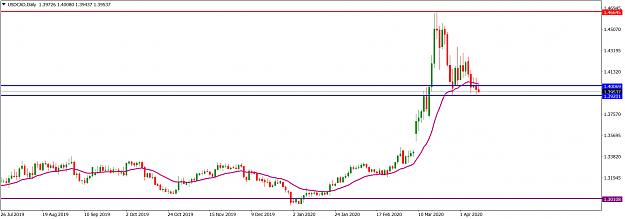
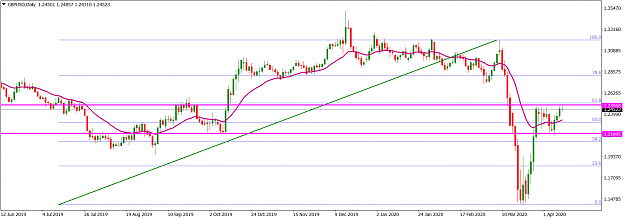
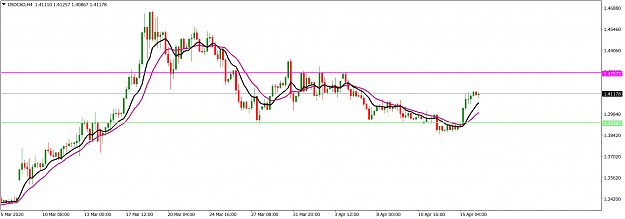
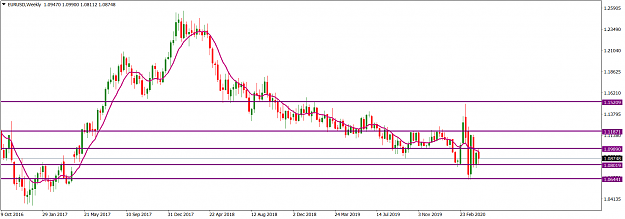
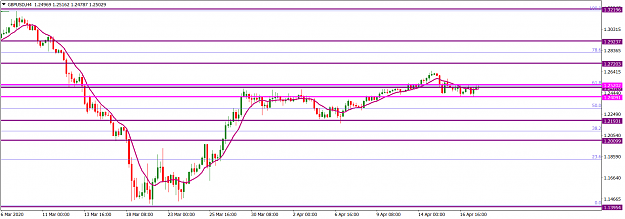
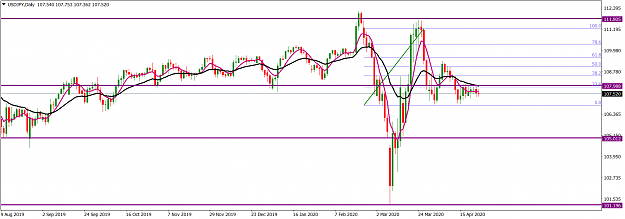
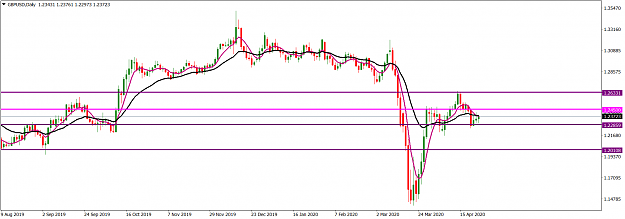
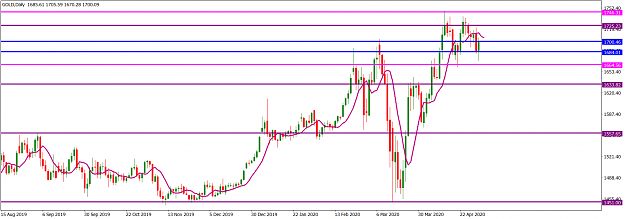
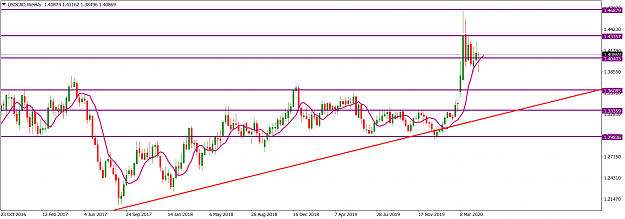
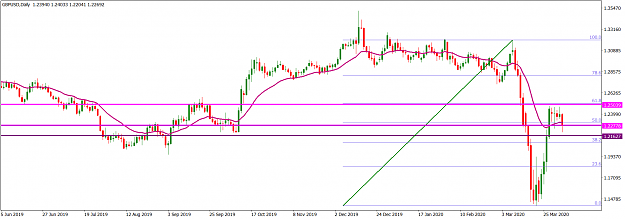
The daily time frame shows a topping/’wicky’ formation from recent candlestick prints around the 50/61.8 Fib zone (bound by magenta horizontal lines) of the most recent downward swing, 1.32030/1.14020. Looking left, the area is aligned with a previous horizontal resistance, and technically susceptible to a southward turnaround. The order flow context favours bears.
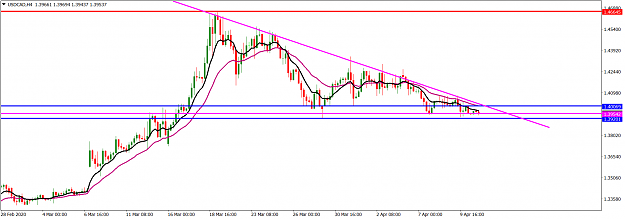
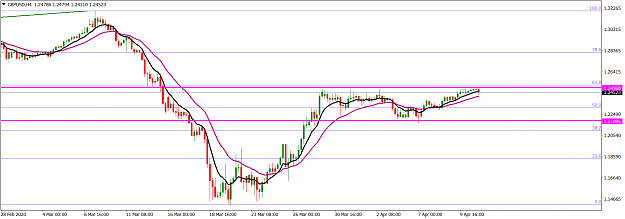
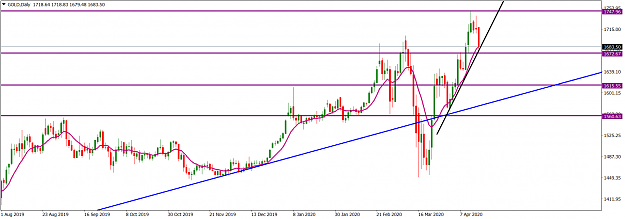
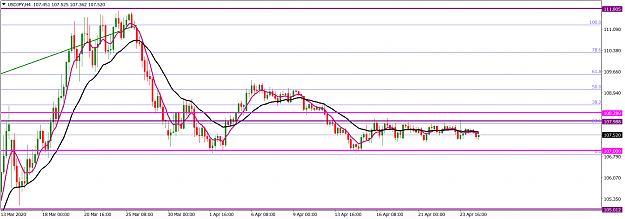
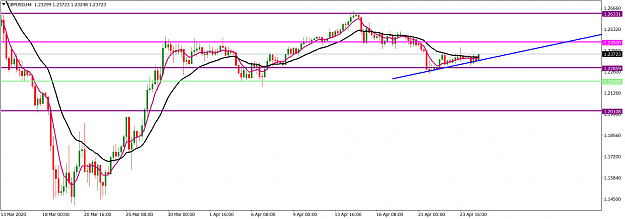
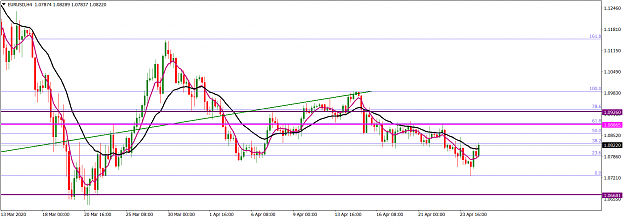
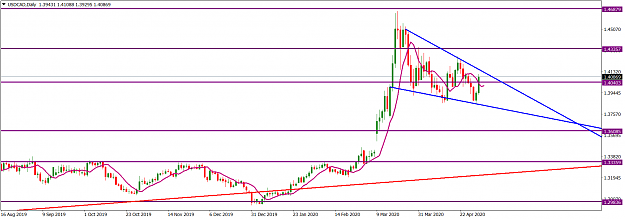
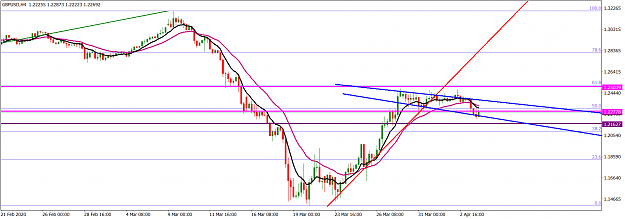
Price action on the H4 time frame has broken below a rising trendline (red), now within an expanding falling wedge (blue) and presently around the 50/61.2 Fib zone of the most recent significant downward swing: the 1.32030/1.142020 swing. Should bears break down the falling wedge, and of course the 50/61.2 Fib zone, we may see a southward drive. I am bearish GBPUSD.
I may be wrong. Trade safe and prosper.
KP
The bearish drop in March from the high of February produced an all-time low around 1.127250 before market operation retraced northward to the 1.24060 area. This was after it failed to break below the 1.21940 area, from where it rallied in October 2019. The March southward drive showed the intent of bears to maintain market control. Nevertheless, the long tail on the March print indicates that bulls are still influential. The 1.21630 area (purple) is the immediate horizontal support.
Attached Image (click to enlarge)
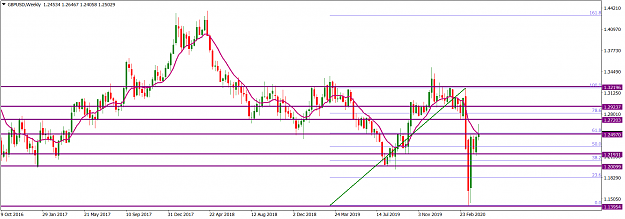
The weekly time frame presently shows a consolidating market operation. The strong bearish print of three weeks ago lacked a follow-through as it was countered by a strong bullish drive a week later. Last week’s candlestick print was a relatively smaller bearish candlestick that failed to break below the 1.22690 area, an area that had been a horizontal support since the second week of October 2019 before it was broken down three weeks ago. Apparently, any bearish drive to be sustainable will have to significantly break down the 1.22690 area. The next significant horizontal support zone is around 1.21630/1.19670.
Attached Image (click to enlarge)
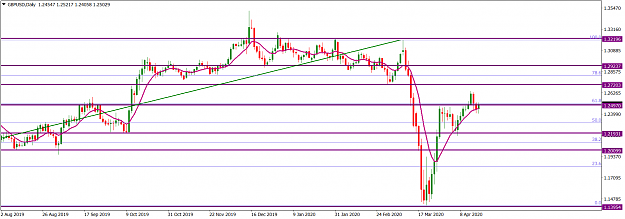
The daily time frame shows a topping/’wicky’ formation from recent candlestick prints around the 50/61.8 Fib zone (bound by magenta horizontal lines) of the most recent downward swing, 1.32030/1.14020. Looking left, the area is aligned with a previous horizontal resistance, and technically susceptible to a southward turnaround. The order flow context favours bears.
Attached Image (click to enlarge)
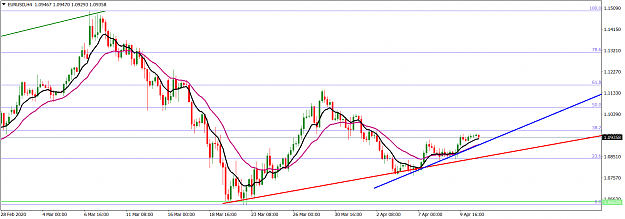
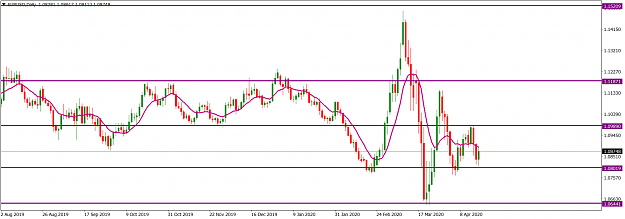
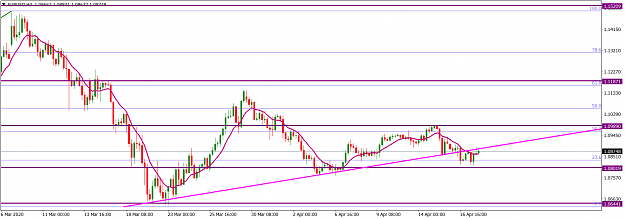
Price action on the H4 time frame has broken below a rising trendline (red), now within an expanding falling wedge (blue) and presently around the 50/61.2 Fib zone of the most recent significant downward swing: the 1.32030/1.142020 swing. Should bears break down the falling wedge, and of course the 50/61.2 Fib zone, we may see a southward drive. I am bearish GBPUSD.
Attached Image (click to enlarge)
I may be wrong. Trade safe and prosper.
KP
Do your homework, follow the footprints of smart money
1