Yen pair too might have potential trade setup tomorrow. {image}
Ignored
Hello, yanah, I so much like this strategy and I'm willing to learn it with all it takes. From the yen pair above, if I saw it earlier on before now, I think I would have entered the trade after the three blue bull candles cos the green wave indicator is shown for potential reversal( y bb is pierced),the third blue bull candle is closed above 5sma, awesome osc is green for the entry candle ( WC eventually turns red), and lastly stoch is moving away from 20 ( oversold) . But u decided not to enter, y? Can u please explain that...I'm curios to know y u exercised patience...
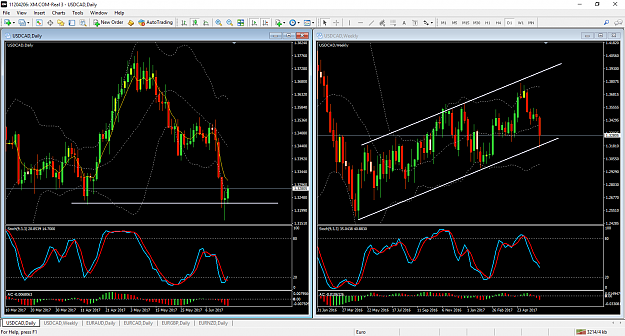
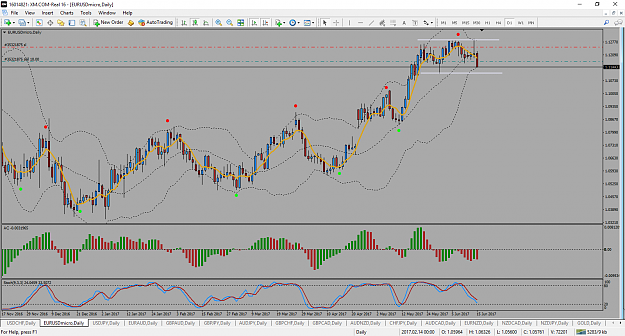
I was going to post the EURCAD chart 4 days ago - sorry I forgot. Perfect entry for this system {image}
Ignored
Hello jmtini, what a good chart you have over there, are those blue lines drawn on ur chart psychological lines or rounded no lines? If so , kindly please upload the indicator and if any further instructions on how it could be watched. I so much like ur clean chart and the way the indicator us portrayed... If u have good support and resistance indicator that could be used too, I wouldn't mind...cheers
{quote} This is regarding the channel you have drawn - is the support line coming from weekly low or 1.11000 level? Resistance line makes sense. Thank you & Greep Pips
Ignored
Hi kski
Weekly lines will only be shown on weekly charts. I prefer my charts to be visibly "clean.
{quote} Hi Yanah, Thanks for the feedback. I mis interpreted your conditions for entry. I saw inside bar before the doji so I thought it meant we can enter the market once the other conditions are met. Stoch looks crossed when the day started. Just to confirm, so we need to see the inside bar happening at the same time stoch should have already crossed? Thanks!
Ignored
Yes, All criterias must be met. There will be plenty of opportunities for you to take trades.
All the best.
{quote} Hello yanah, I have been following ur strategy and kudos to ur for the good work. Regarding the gold daily chart above ,for one taking a sell trade,when the green wave dot appear on the chart, do u take profit immediately or you wait for stoch 9,3,3 to turn from 20 ( oversold above). Thank you
Ignored
Hi
The decision to close trades when dots appear depend on weekly chart.
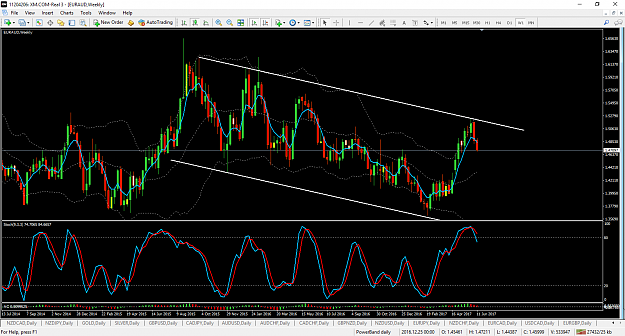
Take a look Euraud weekly candle (last week closed). I have a sell trade still running since
last week. I ignored the dots on daily chart and let profits run.
Somebody gave this analogy: " daily time frame = children; Weekly = parents; Monthly = grandparents."
Parents and grandparents shouldn't be cast aside. They give a bigger and clearer picture of the market
conditions.
Hello yanah! Kindly help clarify the request I put through concerning the comments I made on the potential trades of yen pair and gold...I'm so patiently waiting..thanks
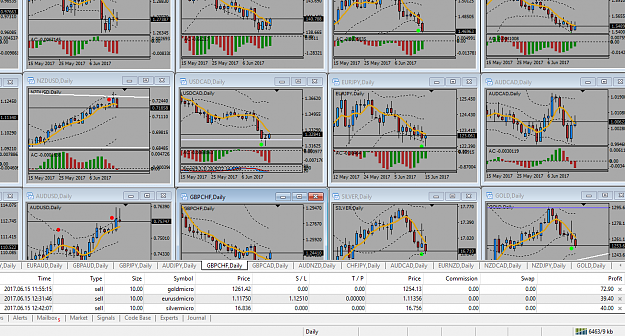
{quote} Hi The decision to close trades when dots appear depend on weekly chart. Take a look Euraud weekly candle (last week closed). I have a sell trade still running since last week. I ignored the dots on daily chart and let profits run. Somebody gave this analogy: " daily time frame = children; Weekly = parents; Monthly = grandparents." Parents and grandparents shouldn't be cast aside. They give a bigger and clearer picture of the market conditions. Cheers {image}
Ignored
Understood master yanah..thanks ..help clarify the yen pair? I noticed u waited patiently, on what course???
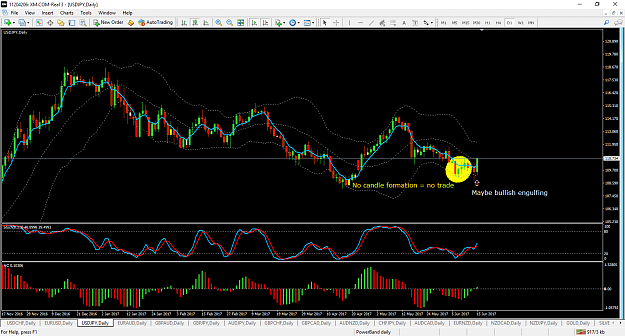
{quote} Hello, yanah, I so much like this strategy and I'm willing to learn it with all it takes. From the yen pair above, if I saw it earlier on before now, I think I would have entered the trade after the three blue bull candles cos the green wave indicator is shown for potential reversal( y bb is pierced),the third blue bull candle is closed above 5sma, awesome osc is green for the entry candle ( WC eventually turns red), and lastly stoch is moving away from 20 ( oversold) . But u decided not to enter, y? Can u please explain that...I'm curios...
Ignored
Hi
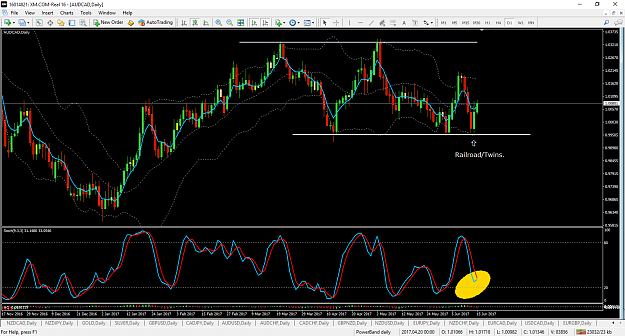
There's no candle formation, so no trade yet. IF the trade was triggered, it would have hit the stop loss.
Filter your trades and save yourself from heartache.
Correct!!! Noted... To add to the buy setup, if 365 ema was on the chart as master yanah indicated, it forms a confluence point with the bb lowerband and the indecision reversal candle ( doji).. I'm really loving ur strategy... I'm on the watch for this set up
{quote} Hi There's no candle formation, so no trade yet. IF the trade was triggered, it would have hit the stop loss. Filter your trades and save yourself from heartache. Hope it clarifies. Thanks {image}
Ignored
Wow.... Absolutely noted....u are right boss....I salute..smile
{quote} Hi There's no candle formation, so no trade yet. IF the trade was triggered, it would have hit the stop loss. Filter your trades and save yourself from heartache. Hope it clarifies. Thanks {image}
Ignored
Looking at the USDYEN pair, the stoch is not in the oversold region. And also very close to the 200 and 365 EMA thus Im staying out. Hope my analysis is correct?
Anyone who could look more into NZDUSD ( I think THE PREVIOUSber candle formation is bearish engulfing). Stoch from overbougt hand AO is red in colour.
Also. GBPNZD, anyone ton clarify that if it's a good setup.