You want Fryes with that?
Anyone still trading Mouteki? 45 replies
Jumper's journal of Mouteki trading 74 replies
Mouteki Trading System 3 replies
Favourable pairs for Mouteki trading... 7 replies
Kalesh's journal of Mouteki Trading 25 replies
Quoting FryesDislikedIgnored
Quoting peterdxbDislikedShort breakout on USD/JPYIgnored
Quoting ThebigmoDislikedThe technique in the mag is about stocks not currency...Ignored
Quoting ThebigmoDislikedRemember these magz are for rich folks who trade long period.Ignored
Quoting BemacDislikedThe charts used in the article are EUR/USD 1hr & Daily.
The article says clearly the analysis is based on stocks. Read the article again, they just used forex charts to analyse on. Most of the articles there are fundementals and long term. How many hear care about the yuan or dollar future projection. Thats all i meant.
This e-mag is free simply by subscribing.
In case anyone forgot, this is a quote from Mouteki's Opening Post.
"
Like I said before I have tried a lot of things and what I will share in this thread is what I have been doing for the past three years on my own and it is bringing me success.
"
Ignored
Quoting Jordan GreccoDislikedHi there,
would you mind posting your chart so I can follow what you see as a breakout. I don't see a short breakout on USDJPY and I wanted to see if I am reading my charts incorrectly. Also if someone else sees the breakout I would appreciate if they could post their chart. Thanks in advance!Ignored

Quoting smjonesDislikedMan it always comes to this doesn't it? I am going to delete some posts, to keep things congenial. It does not matter where this came from. Mouteki has put a great deal of effort into this and I applaud it.. thank you Mouteki.
Now that is enough of this kind of denigration. Lets move on...
Scott
ModeratorIgnored
Quoting carmelDislikedRegarding post 608, its my understanding that we take the trade on the opening of a new candle above the trend line. Is this how you understand it?Ignored
Quoting dangermanDislikedcarmel,
My understanding is this: The upward sloping demand/trendline represents support, so a short would be initiated on a break of this recent support, or a bar opening below the demand/trendline. If we had drawn a supply line (a downward sloping line that represents resistance, then a long trade would be initiated on an upward break of the supply/trendline when a new bar opened above that line.
Hope that helps
JimmyIgnored

Quoting dangermanDislikedJG,
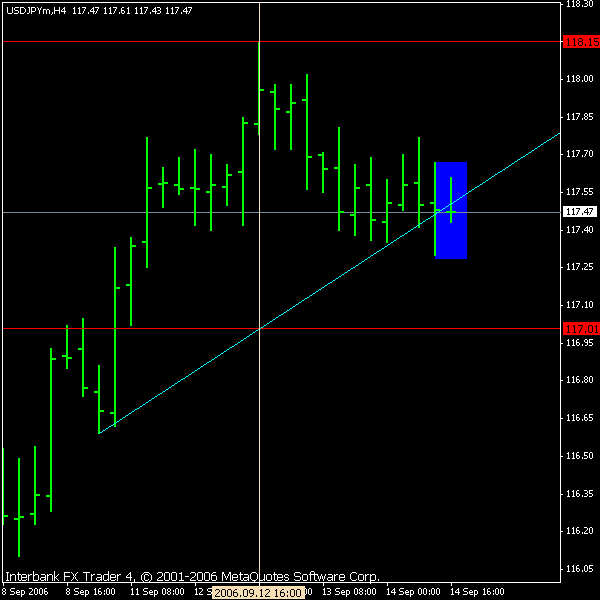
This is my chart on the usd/jpy short breakout.
The shaded bar is the bar that opened below the demand line. The highest high is the top vertical line 118.15, and the vertical line intersects the demand line at 117.01, which would give a target price of 114 pips below the opening of the shaded bar. 117.47 - 114 pips = 116.33.
Thats my take anyway.Ignored
Quoting Jordan GreccoDislikedNothing personal but I tend to disagree with the two points that you have picked. According to Mouteki you should pick the two closest points. In this case going from point A that you picked, you should go over 11 bars (not counting the point A bar) Now ofcourse the slope is quite different and I know there is something in this thread about the S/D line having to go a certain way. Anyway, once again if someone else can shed some light on this it would be greatly appreciated. Thanks!Ignored
Quoting Jordan GreccoDislikedNothing personal but I tend to disagree with the two points that you have picked. According to Mouteki you should pick the two closest points. In this case going from point A that you picked, you should go over 11 bars (not counting the point A bar) Now ofcourse the slope is quite different and I know there is something in this thread about the S/D line having to go a certain way. Anyway, once again if someone else can shed some light on this it would be greatly appreciated. Thanks!Ignored
Quoting nutmg12DislikedJordan,
I think Dangerman picked the correct points. Can you please post a chart with your choices? Counting from Left to Right 11 bars I don't see anything that could be considered support or resistance bar.Ignored
Quoting Jordan GreccoDislikedHi Nutmg12,
According to Mouteki Point A would be the first point that you choose starting from the right. Hence going to point B would be going 11 bars to the left of point A. I hope this is clear.Ignored
Quoting 8toenailsDislikedI hate to break it to you fellas... but Dangerman is correct. If you were to take your own advice and go 11 bars to the left then would the slope of the line be up or down viewing it from left to right? It would be down. This wouldn't qualify as an "uptrend".
Don't get my assessment of the slope confused w/ creating the trendline from right to left. That is something different that Mouteki has done a wonderful job beating into our minds.
Great job on the assessment Dangerman!Ignored
Quoting Jordan GreccoDislikedYou're two toenails short of having complete feet (your name suggests) so I don't know if I should take you seriously ...
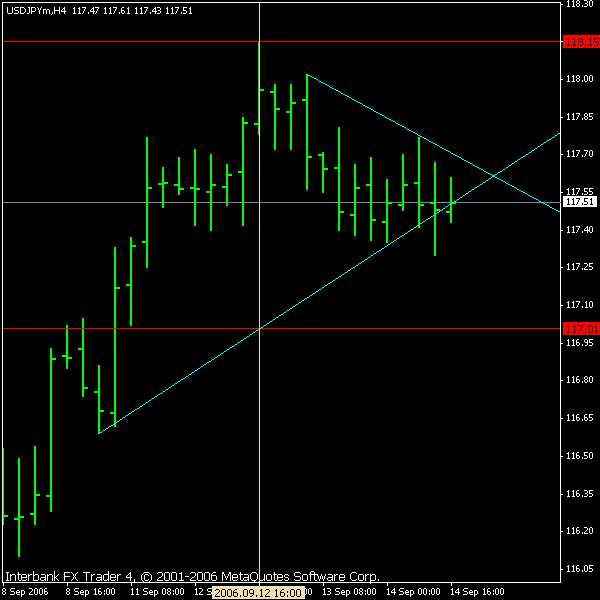
Hope you know I am just kidding. Makes sense what you are saying though. What do you think of the USD JPY downtrend signal forming?Ignored