• Home
  • Forums
  • Trades
  • News
  • Calendar
  • Market
  • Brokers
  • Login
  • Join
  • 11:48am
Menu
  • Forums
  • Trades
  • News
  • Calendar
  • Market
  • Brokers
  • Login
  • Join
  • 11:48am
Sister Sites
  • Metals Mine
  • Energy EXCH
  • Crypto Craft

Options

Bookmark Thread

First Page First Unread Last Page Last Post

Print Thread

Similar Threads

Anyone still trading Mouteki? 45 replies

Jumper's journal of Mouteki trading 74 replies

Mouteki Trading System 3 replies

Favourable pairs for Mouteki trading... 7 replies

Kalesh's journal of Mouteki Trading 25 replies

  • Commercial Content
  • /
  • Reply to Thread
  • Subscribe
  • 820
Attachments: Mouteki Trading
Exit Attachments
Tags: Mouteki Trading
Cancel

Mouteki Trading

  • Last Post
  •  
  • 1 2425Page 262728 233
  • 1 Page 26 233
  •  
  • Post #501
  • Quote
  • Sep 13, 2006 12:44pm Sep 13, 2006 12:44pm
  •  summitfx
  • | Additional Username | Joined Jun 2006 | 787 Posts
I agree-Thanks Peter for all of your input. I understand your point. Perhaps only the Threadmaker should post and only ?'s should be submitted. I appreciate all viewpoints.


Quoting Sinar FX
Disliked
We don't want you to disappear. We all newbie still need you and to learn new thing/advise from you..
Ignored
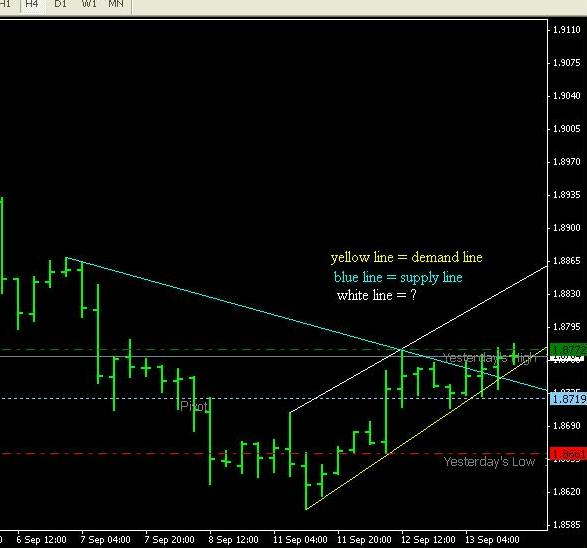
Trade what you see - Not what you think
 
 
  • Post #502
  • Quote
  • Sep 13, 2006 1:19pm Sep 13, 2006 1:19pm
  •  Thebigmo
  • | Joined Jul 2006 | Status: Member | 52 Posts
I will repeat my post since nobody answered it as of yet:

Could someone please check slide 24 in the powerpoint presentation and tell me why he did not draw a vertical line through the blue candle with the highest peak to determine the intersection point with the demand trend line. But instead uses the red candle after the blue one to determine the intersection point. He does that often in the slide show.
<!-- / message -->I assume you already know why, if not then i really don't see how you can use that method since its an important distinction and could affect your take profit point.

Just my two cents.
 
 
  • Post #503
  • Quote
  • Edited 1:50pm Sep 13, 2006 1:39pm | Edited 1:50pm
  •  nchosen
  • | Joined Jun 2006 | Status: Member | 172 Posts
Quoting Thebigmo
Disliked
I will repeat my post since nobody answered it as of yet:

Could someone please check slide 24 in the powerpoint presentation and tell me why he did not draw a vertical line through the blue candle with the highest peak to determine the intersection point with the demand trend line. But instead uses the red candle after the blue one to determine the intersection point. He does that often in the slide show.
<!-- / message -->I assume you already know why, if not then i really don't see how you can use that method since its an important distinction and could affect your take profit point.

Just my two cents.
Ignored
My chart (in slide 24) does not include a vertical line at all. Could you recheck or post the chart? He does seem to draw horizontal line below the red candle (right to the highest high bar), which is not what we are waiting for. I think you have a point here.

nchosen
 
 
  • Post #504
  • Quote
  • Sep 13, 2006 1:45pm Sep 13, 2006 1:45pm
  •  Thebigmo
  • | Joined Jul 2006 | Status: Member | 52 Posts
I know it does not include a physical vertical line, i meant that we usually draw that vertical line either physically or visually through the bar of the highest peak in the demand trend line and then we look for the interception of that line with the demand trend. However more than once he uses other candles also to determine the intersection point which can affect your pip calculation, sometimes significantly.
 
 
  • Post #505
  • Quote
  • Edited 2:03pm Sep 13, 2006 1:52pm | Edited 2:03pm
  •  nchosen
  • | Joined Jun 2006 | Status: Member | 172 Posts
Quoting Thebigmo
Disliked
I know it does not include a physical vertical line, i meant that we usually draw that vertical line either physically or visually through the bar of the highest peak in the demand trend line and then we look for the interception of that line with the demand trend. However more than once he uses other candles also to determine the intersection point which can affect your pip calculation, sometimes significantly.
Ignored
I think you are right here. Can you point other slides too?

nchosen

I checked myself and I think slide #29 has also a false vertical line. The right one is next to right. Lowest low is still right. Right - eh?

nchosen
 
 
  • Post #506
  • Quote
  • Sep 13, 2006 2:06pm Sep 13, 2006 2:06pm
  •  Thebigmo
  • | Joined Jul 2006 | Status: Member | 52 Posts
Like look at slide 24 and compare that with slide 40, big difference. I am not sure that timing has anything to do with it, but lets see.


This trading style is very close to my trading style so i am very interested in understanding it well.
 
 
  • Post #507
  • Quote
  • Sep 13, 2006 2:13pm Sep 13, 2006 2:13pm
  •  nchosen
  • | Joined Jun 2006 | Status: Member | 172 Posts
Did anyone go LONG AUD/USD an hour ago?

nchosen
 
 
  • Post #508
  • Quote
  • Sep 13, 2006 2:17pm Sep 13, 2006 2:17pm
  •  fxbrazil
  • | Joined Sep 2006 | Status: Member | 1 Post
I went long aud/usd at 0.7535
 
 
  • Post #509
  • Quote
  • Sep 13, 2006 2:23pm Sep 13, 2006 2:23pm
  •  nchosen
  • | Joined Jun 2006 | Status: Member | 172 Posts
Quoting fxbrazil
Disliked
I went long aud/usd at 0.7535
Ignored
I opened it @0.7534. It is currently going against us, but we'll see...
 
 
  • Post #510
  • Quote
  • Sep 13, 2006 2:25pm Sep 13, 2006 2:25pm
  •  nitman
  • | Joined Nov 2005 | Status: Member | 386 Posts
Quoting nchosen
Disliked
Did anyone go LONG AUD/USD an hour ago?

nchosen
Ignored
I am!
 
 
  • Post #511
  • Quote
  • Sep 13, 2006 2:30pm Sep 13, 2006 2:30pm
  •  brainjt
  • | Joined Feb 2006 | Status: brainjt | 376 Posts
chart audusd, why you went long?
could you explain it thx bj
Attached Image
BJ
 
 
  • Post #512
  • Quote
  • Sep 13, 2006 2:49pm Sep 13, 2006 2:49pm
  •  nchosen
  • | Joined Jun 2006 | Status: Member | 172 Posts
Quoting brainjt
Disliked
chart audusd, why you went long?
could you explain it thx bj
Ignored
Here is my chart for AUD/USD and my settings.
Attached Image
 
 
  • Post #513
  • Quote
  • Sep 13, 2006 3:00pm Sep 13, 2006 3:00pm
  •  dangerman
  • | Joined Sep 2005 | Status: Member | 114 Posts
Hi all,

A question to the thread about the slope of demand and supply lines.

In Mouteki's document he states clearly that "we construct an ascending line to represent demand and a descending line to represent supply".

In the gbp/usd chart below I have drawn a yellow demand line and a blue supply line, and have also drawn a white supply? line.

Mouteki also states that "recent price activity is more significant than historical price activity".

The bar at the end of the white line meets the requirements of having two bars on either side with lower highs, and this price action is more recent than the bar at the end of the blue line, which would make it more significant?, but the slope of this line is up.

I guess this would be more like a channel breakout system?

Wouldn't the fact that Mouteki uses the terms supply and demand lines instead of uptrend and downtrend lines make it feasable that a supply line could slope upward and a demand line could slope downward?

My thinking may be all backwards here so I'm hoping someone will straighten me out if so.

Thanks
Jimmy
Attached Image
 
 
  • Post #514
  • Quote
  • Sep 13, 2006 3:15pm Sep 13, 2006 3:15pm
  •  nitman
  • | Joined Nov 2005 | Status: Member | 386 Posts
Quoting dangerman
Disliked
Hi all,

A question to the thread about the slope of demand and supply lines.

In Mouteki's document he states clearly that "we construct an ascending line to represent demand and a descending line to represent supply".

In the gbp/usd chart below I have drawn a yellow demand line and a blue supply line, and have also drawn a white supply? line.

Mouteki also states that "recent price activity is more significant than historical price activity".

The bar at the end of the white line meets the requirements of having two bars on either side with lower highs, and this price action is more recent than the bar at the end of the blue line, which would make it more significant?, but the slope of this line is up.

I guess this would be more like a channel breakout system?

Wouldn't the fact that Mouteki uses the terms supply and demand lines instead of uptrend and downtrend lines make it feasable that a supply line could slope upward and a demand line could slope downward?

My thinking may be all backwards here so I'm hoping someone will straighten me out if so.

Thanks
Jimmy
Ignored
If you want to use the white line, then you have to wait for significantly strong trend in the upward movement to break that line before you get a buy signal. By that time, the market is probably going to be exhausted from previous price projection.
 
 
  • Post #515
  • Quote
  • Sep 13, 2006 3:26pm Sep 13, 2006 3:26pm
  •  dangerman
  • | Joined Sep 2005 | Status: Member | 114 Posts
Quoting nitman
Disliked
If you want to use the white line, then you have to wait for significantly strong trend in the upward movement to break that line before you get a buy signal. By that time, the market is probably going to be exhausted from previous price projection.
Ignored
nitman,

Point well taken, I see what you are saying and you're probably right.

Thanks
Jimmy
 
 
  • Post #516
  • Quote
  • Sep 13, 2006 3:44pm Sep 13, 2006 3:44pm
  •  smjones
  • Joined Mar 2006 | Status: THANK YOU MERLIN,TWEE and FF Team | 4,603 Posts
Tom DeMark defines a Demand line as line drawn from right to left connecting the most recent swing low with the second most recent swing low that is lower than the right one. According to this a line drawn above price cannot by definition be a demand line, nor can the white line be a supply line, because it is the wrong slope

The opposite is true for a supply line.
 
 
  • Post #517
  • Quote
  • Sep 13, 2006 3:59pm Sep 13, 2006 3:59pm
  •  dangerman
  • | Joined Sep 2005 | Status: Member | 114 Posts
Quoting PeterFM
Disliked
As there may be some debate, sometime, about the S/D lines and should they be sloping up or down in order to qualify, I thought I'd point you all to this site, and this page in particular. Please note the opening comments on this page. Although the site's focus will be, primarily, on stocks and/or indexes (indices?) I think they may still have value for us.

It's important to realise that, at any given time, slopes may not fit the desired angle (or what we think should be that angle). When lines are running in a similar direction, not necessarily parallel, they create a wedge formation.

It's worthwhile studying this as it will help you look at the charts correctly, rather than, maybe, drawing your lines just to make them slope up or down.

http://www.decisionpoint.com/tacourse/Wedge.html

Hope it helps

Peter
Ignored
Thanks Peter and sm,

I thought I was barking up the wrong tree with that, and am glad to have your inputs. The site describing the wedge formations and how they might play into your decision for entering a trade is good.

So, demand lines slope up and supply lines slope down, but lines that might help us visualise other patterns can also help us see where price might be more likely to go.

Thanks again
Jimmy
 
 
  • Post #518
  • Quote
  • Sep 13, 2006 4:13pm Sep 13, 2006 4:13pm
  •  smjones
  • Joined Mar 2006 | Status: THANK YOU MERLIN,TWEE and FF Team | 4,603 Posts
Quoting dangerman
Disliked
Thanks Peter and sm,


So, demand lines slope up and supply lines slope down, but lines that might help us visualise other patterns can also help us see where price might be more likely to go.

Thanks again
Jimmy
Ignored
Yes perhaps this is true. Anything that helps to bring confidence to the trade, but technical formations do not appear to be a part of this method...
However, I personally think they are valid confluences... thanks scott
 
 
  • Post #519
  • Quote
  • Sep 13, 2006 4:34pm Sep 13, 2006 4:34pm
  •  NipthePips
  • | Joined Jul 2006 | Status: Your friendly Daily Pip Nipper. | 399 Posts
Quoting smjones
Disliked
Don't you mean left, not right...
Ignored
When I counted...I counted 13 candles to the right of the second candle that he chosen (second as in point B)
Nothing is hard, some things just take more time and discipline.
 
 
  • Post #520
  • Quote
  • Sep 13, 2006 4:40pm Sep 13, 2006 4:40pm
  •  NipthePips
  • | Joined Jul 2006 | Status: Your friendly Daily Pip Nipper. | 399 Posts
This is what I think he was referring to

http://img126.imageshack.us/img126/3078/gbprk0.gif
Nothing is hard, some things just take more time and discipline.
 
 
  • Commercial Content
  • /
  • Mouteki Trading
  • Reply to Thread
    • 1 2425Page 262728 233
    • 1 Page 26 233
4 traders viewing now
  • More
Top of Page
  • Facebook
  • Twitter
About FF
  • Mission
  • Products
  • User Guide
  • Media Kit
  • Blog
  • Contact
FF Products
  • Forums
  • Trades
  • Calendar
  • News
  • Market
  • Brokers
  • Trade Explorer
FF Website
  • Homepage
  • Search
  • Members
  • Report a Bug
Follow FF
  • Facebook
  • Twitter

FF Sister Sites:

  • Metals Mine
  • Energy EXCH
  • Crypto Craft

Forex Factory® is a brand of Fair Economy, Inc.

Terms of Service / ©2023