As a newbie, I'm just wondering what shall we do during news break. For example, from the mouteki chart, now showing to go long with GDP till perhaps 1.8754. But 4.30pm today (GMT8), there is news coming out.
Normally shall we remain in the position or close first and re enter again.
Thanks in advance....
Shah
For every action there is an equal and opposite reaction.....
I have been looking at this thread and it looks excellent, but I use oanda and they only have 3hr charts, and it goes flat on the weekend. do you still think this will work?
|
Joined Jul 2006
|
Status: Your friendly Daily Pip Nipper.
|399 Posts
Quoting EMM7ERSON
Disliked
I have been looking at this thread and it looks excellent, but I use oanda and they only have 3hr charts, and it goes flat on the weekend. do you still think this will work?
Ignored
There is a way to make Oanda erase the weekend data...fool around with your settings there is something in there that allows you to alter the times it records. As far as 4 hr charts i dont know with oanda. What i would reccomend is just opening a demo account with someone like IBFX and using the MT4 platform
Nothing is hard, some things just take more time and discipline.
The Consumer Price Index (CPI) measures the rate of inflation experienced by consumers. The reading represents the monthly change in the average price of a fixed basket of goods and services purchased by consumers. Higher inflation generally leads to higher interest rates, which tend to strengthen the country's currency.
Like CPI, the RPI reflects the monthly price change in consumer goods and services. RPI differs from CPI in that it only measures goods and services bought for the purpose of consumption by the vast majority of households.
One thing affecting GBP tonight is the news which is due in about 20 minutes. What has me more confused is that there seems to me to be more volatility than I would expect and that it is affecting many pairs.
I have been obsedrving what appears to me to be totally aimless prices going repeatedly up and down. I can discern no pattern and this seems to be affecting pairs as disparate as GBP/JPY and USD/CAD.
Has anybody else seen this? Does anyone have any idea what is happening? Some of the pairs seem to be bouncing so much that it is almost like watching a tennis match.
The Consumer Price Index (CPI) measures the rate of inflation experienced by consumers. The reading represents the monthly change in the average price of a fixed basket of goods and services purchased by consumers. Higher inflation generally leads to higher interest rates, which tend to strengthen the country's currency.
Like CPI, the RPI reflects the monthly price change in consumer goods and services. RPI differs from CPI in that it only measures goods and services bought for the purpose of consumption by the vast majority of households.
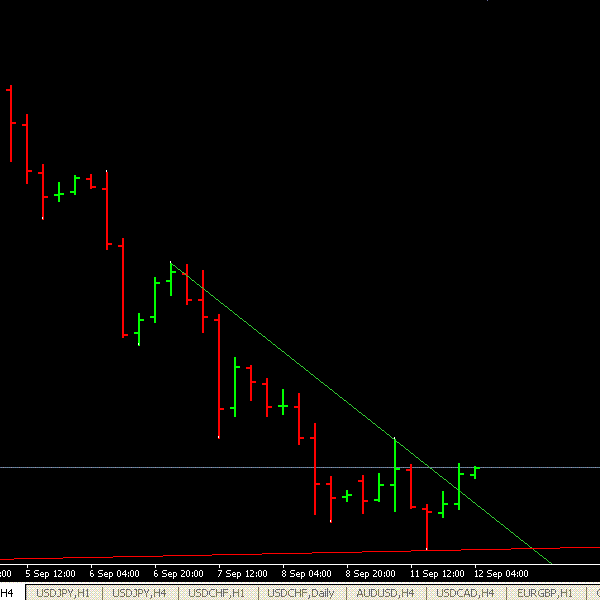
i remeber reading in the early method description that we should think outside the box a little and draw our trendlines from right to left.
I think this means pick the most recent formed resistance support point then with each new bar connect them together easy to do with 4 hour time frame then when new bar opens change it until the setup is there then trade it.
Working back from the new bar so the break out will be the earliet possible entry.
for some reason i couldnt get moutekis last charts of eur/jpy and cad (they were red crossed anyone else have this problem) but i assuming he used this method and got in right at the beginning of the break out as soon as the new resistance point had formed.
If this is the way then an indicator that redraws its lines every new bar would be good.
Anyway great thread thread mouteki and i love the suspense effect keeping everyone coming back for more
Philip
|
Joined Jul 2006
|
Status: Your friendly Daily Pip Nipper.
|399 Posts
Quoting dailydow
Disliked
i remeber reading in the early method description that we should think outside the box a little and draw our trendlines from right to left.
I think this means pick the most recent formed resistance support point then with each new bar connect them together easy to do with 4 hour time frame then when new bar opens change it until the setup is there then trade it.
Working back from the new bar so the break out will be the earliet possible entry.
for some reason i couldnt get moutekis last charts of eur/jpy and cad (they were red crossed anyone else have this problem) but i assuming he used this method and got in right at the beginning of the break out as soon as the new resistance point had formed.
If this is the way then an indicator that redraws its lines every new bar would be good.
Anyway great thread thread mouteki and i love the suspense effect keeping everyone coming back for more
Philip
Ignored
Ive treid out both indicators...both redraw lines after new qualifying bars
Nothing is hard, some things just take more time and discipline.
I have read through your document. Vey impressive and easy to understand. I have put it into practice, as far as calculating projected prices.
My question is, and I apologise for it being very ignorant but I am new to this- How do you determine which trade to go for? What I am asking is how do you choose wether or not to go for the downtrend or uptrend?
As fr as I understand you have taught us how to calculate the projected prices for both movements, but at the end of the day which trade do you execute?
|
Joined Jul 2006
|
Status: Your friendly Daily Pip Nipper.
|399 Posts
Quoting Schpundoolas
Disliked
I have read through your document. Vey impressive and easy to understand. I have put it into practice, as far as calculating projected prices.
My question is, and I apologise for it being very ignorant but I am new to this- How do you determine which trade to go for? What I am asking is how do you choose wether or not to go for the downtrend or uptrend?
As fr as I understand you have taught us how to calculate the projected prices for both movements, but at the end of the day which trade do you execute?
Thanks
Ignored
This is a counter trend system...so I usually would go for the trade that breaks the current strong trend. But what most people are doing is this: Draw both deman and supply lines (if both are there) and whichever one breaks first trade that direction...some even put a small stoploss over the other trend line just in case the trade reverses and breaks out the opposite direction. Hope that helps
Nothing is hard, some things just take more time and discipline.
|
Joined Jul 2006
|
Status: Your friendly Daily Pip Nipper.
|399 Posts
Quoting dailydow
Disliked
ok tks nipthepips i just noticed there is a alert feature as well on the mouteki indicator just flashed a cad short
Ignored
Yea the other one looks a little bit more colorful but the Mouteki one is my favorite...has basic price projection lines and trendlines, and the best part, the alert . If you would of had the indicator running earlier you would of gotten the USDCAD flashed short around 1.1212
Nothing is hard, some things just take more time and discipline.