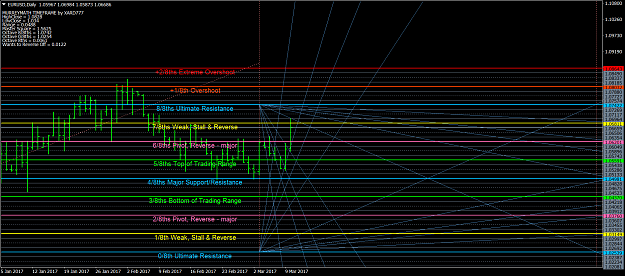
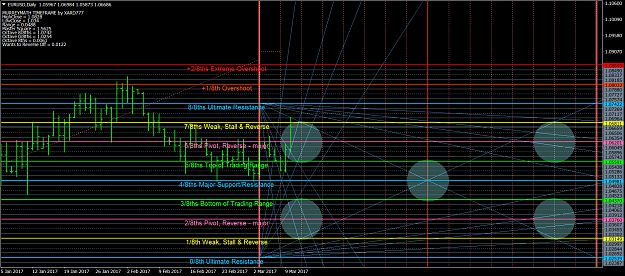
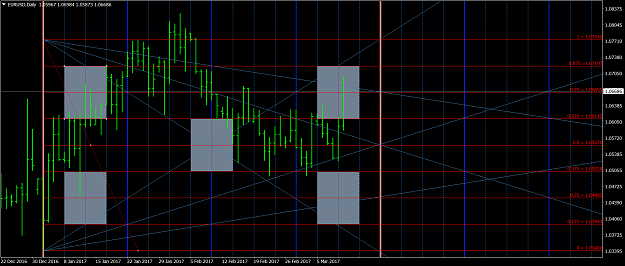
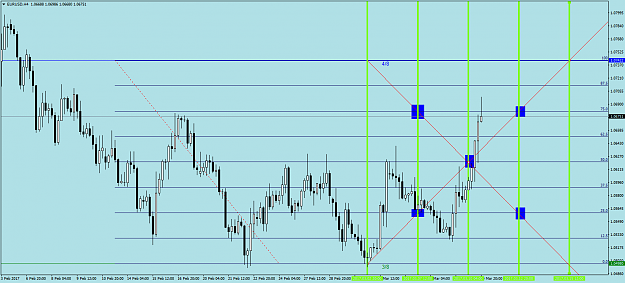
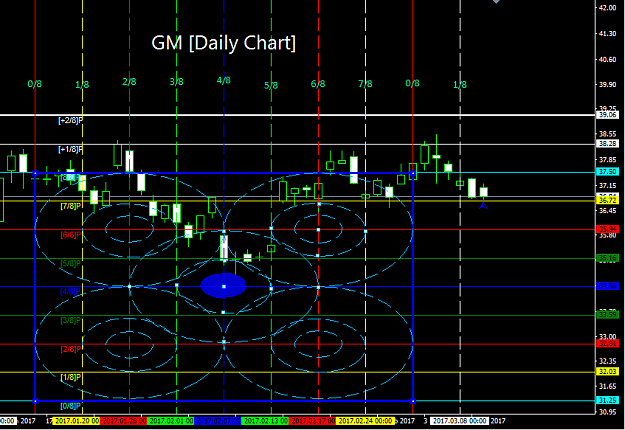
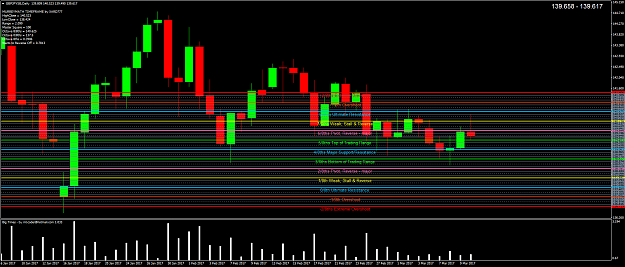
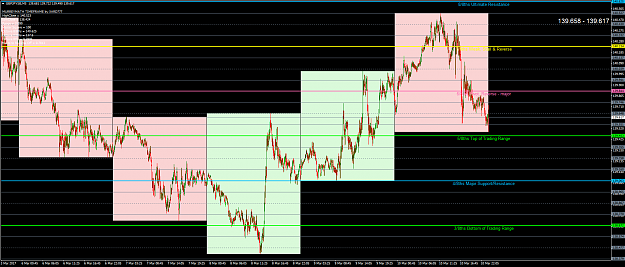
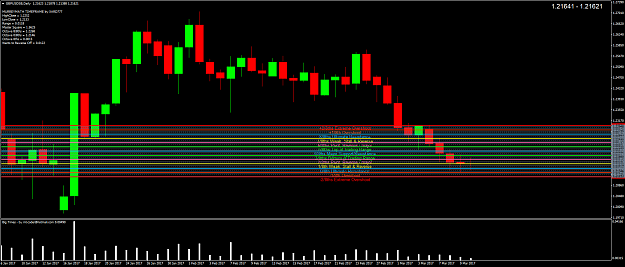
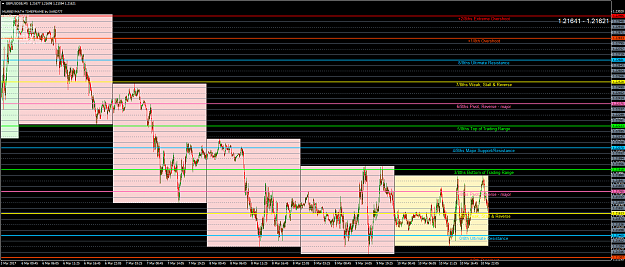
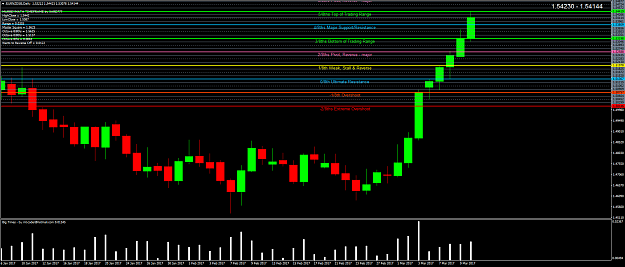
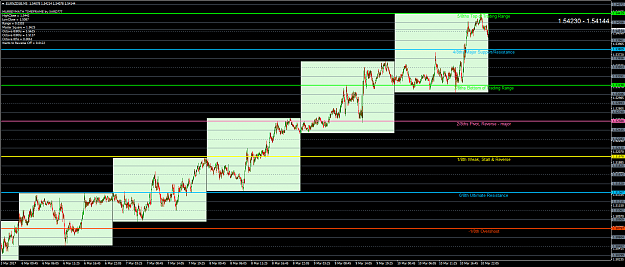
DislikedMurrey says he can predict turning points to within 4 days, so does this give us another way to scalp of Daily charts, perhaps the use of Daily range expectation might help with this {image} {image}Ignored
Attached Image(s) (click to enlarge)
1