• Home
  • Forums
  • Trades
  • News
  • Calendar
  • Market
  • Brokers
  • Login
  • Join
  • User/Email: Password:
  • 8:57pm
Menu
  • Forums
  • Trades
  • News
  • Calendar
  • Market
  • Brokers
  • Login
  • Join
  • 8:57pm
Sister Sites
  • Metals Mine
  • Energy EXCH
  • Crypto Craft

Options

Bookmark Thread

First Page First Unread Last Page Last Post

Print Thread

Similar Threads

Murrey Math indicator is very useful in Forex 66 replies

Murrey Math lines 6 replies

Murrey Math Daily System 568 replies

Murrey Math Line signal 9 replies

Murrey math trading 1 reply

  • Trading Systems
  • /
  • Reply to Thread
  • Subscribe
  • 16
Attachments: Murrey Math Swing Progression
Exit Attachments

Murrey Math Swing Progression

  • Last Post
  •  
  • Page 1 2
  • Page 1 2
  •  
  • Post #1
  • Quote
  • First Post: Dec 8, 2008 4:55pm Dec 8, 2008 4:55pm
  •  mer071898
  • Joined Jan 2007 | Status: Every new idea looks crazy at first | 1,620 Posts

I've designed this system especially for those who do not like to trade shorter time frames such as myself. With owning a business I don't have the time to get up at 2 a.m. and sit in front of my screen all night long and then go to work at 8 a.m. I enjoy spending time with my family and this system allows me to do that.

Chart Setup

The only indicator I use is my Murrey indicator, Magnified Market Price indicator (for visuals only), and the ZigZag indicator for directional confirmation and possible early exits. I use the daily because as we all know Murrey indicators (no matter which version you use) after a certain amount of time will redraw a new cycle of Murrey lines when the old one is completed and will usually be different every time. Sometimes you may not get the indicator to redraw for 6 months or more. I can use all of the 25 pairs listed below (because the system trades so infrequently) plus I am testing out the Gold Charts. You may trade any pair with this so chose whatever you like, especially if you have pairs like Gbp/Try, Eur/Try, and Usd/Try. The reason why is I only take trades if I can earn positive swap, and the Try pairs are the best for this.

Pairs Used

Eur/Usd, Gbp/Usd, Aud/Usd, Nzd/Usd, Usd/Chf, Eur/Chf, Gbp/Chf, Cad/Chf, Nzd/Chf, Aud/Chf, Usd/Jpy, Eur/Jpy, Chf/Jpy, Aud/Jpy, Cad/Jpy, Gbp/Jpy, Nzd/Jpy, Usd/Cad, Aud/Cad, Gbp/Cad, Eur/Gbp, Gbp/Aud, Gbp/Nzd, Aud/Nzd, Eur/Nzd, and Gold.

Trade parameters

Ok, here we go. The basis for the system is we are going to set up three Buy Limit or Sell Limit pending orders at these Murrey levels and double lot size as we break lower or higher on the ladder. For example, for shorts place trades as such:

8/8 -1 lot
+1/8 -2 lots
+2/8 -4 lots

For longs place you trades like this:

0/8 -1 lot
-1/8 -2 lots
-2/8 -4 lots

You can put whatever lots sizes you want in there. I scale in as I go up or down to help gain back a losing position as price rebounds from these critical levels. Why? Keep in mind that price doesn't always stop at the 8/8 or 0/8 levels like you'd think they would. A lot of times the price will break through and go on to hit the +1/8 and -1/8 levels and, on occasion, the +2/8 and -2/8 levels.

Before placing these orders I check where the price is in relation to the middle 4/8 Murrey line. If above, I look to place pending orders at the overbought levels. If below, I'll place them at the oversold levels.My Initial stop will be a little bit past the +2/8 or -2/8 levels and you may trail it if you like but I don't move my stops until I break a couple of levels. If you still want trail it I suggest to take the difference between two Murrey lines X 2 to allow room for the trade to breathe. You will experience some bigger drawdowns because of the larger timeframe, stops, and take profit levels, so please use smart money management to trade safely.

Take Profit is always up to your discretion but I will be using the 2/8 and 6/8 strong levels for my take profit. Sometimes if I get an opposite arrow with the ZigZag indicator I may look into closing the trade early to be safe and not be too greedy. And again, take advantage of these longer trades by only looking to take the trade as long as you can earn positive swap!

Attached Files
File Type: mq4 Murrey_Math_Line_X_eng.mq4   13 KB | 2,341 downloads
File Type: mq4 Magnified Market Price.mq4   1 KB | 1,965 downloads
  • Post #2
  • Quote
  • Dec 8, 2008 4:56pm Dec 8, 2008 4:56pm
  •  mer071898
  • Joined Jan 2007 | Status: Every new idea looks crazy at first | 1,620 Posts
Here is the ZigZag indicator and the template I use.
Attached Files
File Type: mq4 ZigZag_Pointer_alert_email.mq4   6 KB | 1,612 downloads
File Type: tpl plain+murrey.tpl   8 KB | 1,694 downloads
 
 
  • Post #3
  • Quote
  • Dec 8, 2008 5:46pm Dec 8, 2008 5:46pm
  •  mer071898
  • Joined Jan 2007 | Status: Every new idea looks crazy at first | 1,620 Posts
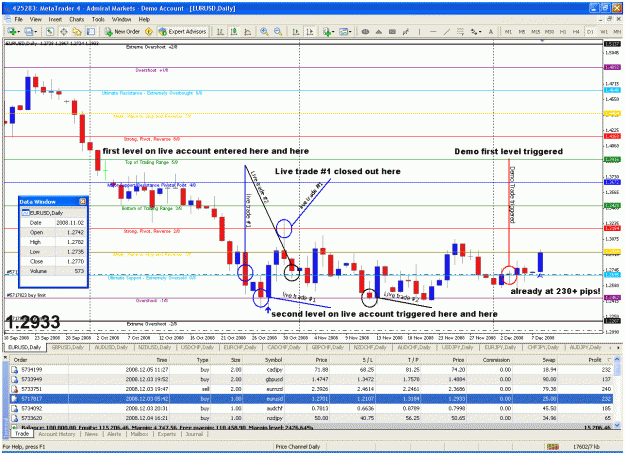
Here are some current trades I am on right now to show you how the setups work. I've actually been in two trades in my live account on this pair since 10/24. The first live trade (in blue) was closed out on 10/30 at 1.3184 for 1 lot with 489 pips and 2 lots with 732 pips along with 5-6 days of positive swap. The second live trade (in black) is currently still going with 32 days of swap accrued so far and counting. For trades on this thread I will be using a demo account only. I actually was late and missed the entry as price was sitting below the 0/8 already and normally we would have a 1 lot buy limit order placed at 1.2695, 2 lots at 1.2452, and 4 lots at 1.2207. I entered a buy stop order instead (in red) on 12/3 to catch the move back up. We will be targeting 1.3184 for our Take Profit and as you can see we are already up 231 pips as of this pic.
Attached Image (click to enlarge)
Click to Enlarge

Name: murrey.gif
Size: 63 KB
 
 
  • Post #4
  • Quote
  • Dec 8, 2008 6:39pm Dec 8, 2008 6:39pm
  •  mer071898
  • Joined Jan 2007 | Status: Every new idea looks crazy at first | 1,620 Posts
As you can see some of the trades I am in started with 2 lots because price was already past the +1/8 or -1/8 at the time I looked at the chart. As I did with Eur/Usd, I placed a buy or sell stop order instead, depending on what the chart called for in place of the buy or sell limit order we'd normally use, to catch price as it moved back up or down through the levels. So don't feel you've lost the trade if you miss an entry as you can catch on the rebound.
Attached Image (click to enlarge)
Click to Enlarge

Name: murrey.gif
Size: 60 KB
 
 
  • Post #5
  • Quote
  • Edited at 7:34pm Dec 8, 2008 6:49pm | Edited at 7:34pm
  •  mer071898
  • Joined Jan 2007 | Status: Every new idea looks crazy at first | 1,620 Posts
As we can see see Eur/Chf looks like it could produce a trade setup but as we look at the swap we would not take these trades as they would produce negative swap which we do not want. I'm not saying you could not take this trade, but why give away money as we have plenty of pairs to watch and a lot of pips to earn so be patient and smart.
Attached Image (click to enlarge)
Click to Enlarge

Name: murrey.gif
Size: 114 KB
 
 
  • Post #6
  • Quote
  • Dec 9, 2008 9:23pm Dec 9, 2008 9:23pm
  •  mer071898
  • Joined Jan 2007 | Status: Every new idea looks crazy at first | 1,620 Posts
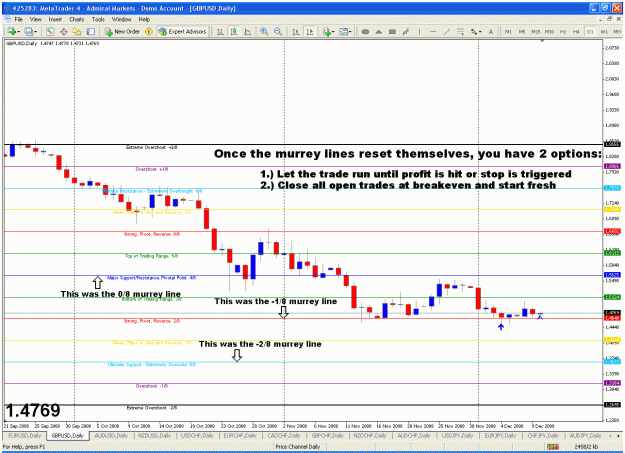
Here's a good example of the Murrey line resetting themselves at new intervals. I've marked where the old trades were placed in comparison to the new lines. My personal preference is to close all open trades once we cumulatively hit a breakeven point and look for other trades. There are too many pairs out there to risk a trade that might turn around on you.
Attached Image (click to enlarge)
Click to Enlarge

Name: murrey.gif
Size: 46 KB
 
 
  • Post #7
  • Quote
  • Dec 9, 2008 11:14pm Dec 9, 2008 11:14pm
  •  Ronald Raygun
  • Joined Jul 2007 | Status: 31 y/o Investor/Trader/Programmer | 5,016 Posts
The main problem I have with Murrey Math is that the lines can change as time passes, and new highs/lows are set.

How do you avoid that?
 
 
  • Post #8
  • Quote
  • Dec 9, 2008 11:57pm Dec 9, 2008 11:57pm
  •  mer071898
  • Joined Jan 2007 | Status: Every new idea looks crazy at first | 1,620 Posts
I had that same issue when trying to use them on smaller timeframes like 5 or 15 minute time frames. The problem is you can't avoid it, just try to limit your losses as much as you possibly can in case price does a u-turn on you.

I finally jumped up to using daily and weekly time frames so they don't change as often. There have been quite a few pairs that I have tracked that didn't redraw for well over 3-4 months on daily and some that have gone 6 months or more on the weekly. You can check the charts and see that the average for most pairs will run about 30-45 days before a redraw.

Like the example above, I will try to close out any open trades once the total profit of all the trades combined reaches breakeven. After the change, I will also move the initial stop on all open trades to the nearest murrey line to limit the amount of loss as much as possible and delete any pending orders that haven't been triggered. The majority of the open trades that are still open do eventually hit breakeven or a least go into profit a little. I have experienced a few losses with this as you can expect which is part of the game.

Ronald, I know you do some programming as well and I know this is a little off base here, but I am looking to compensate someone who can tackle an EA for this, interested??
 
 
  • Post #9
  • Quote
  • Dec 10, 2008 1:55am Dec 10, 2008 1:55am
  •  Ronald Raygun
  • Joined Jul 2007 | Status: 31 y/o Investor/Trader/Programmer | 5,016 Posts
I tried writing an EA for Murrey Math, can't figure out how the octave-based thing works.
 
 
  • Post #10
  • Quote
  • Dec 10, 2008 2:46am Dec 10, 2008 2:46am
  •  mer071898
  • Joined Jan 2007 | Status: Every new idea looks crazy at first | 1,620 Posts
Hey, no problem just thought I'd ask.
 
 
  • Post #11
  • Quote
  • Dec 10, 2008 6:32pm Dec 10, 2008 6:32pm
  •  mer071898
  • Joined Jan 2007 | Status: Every new idea looks crazy at first | 1,620 Posts
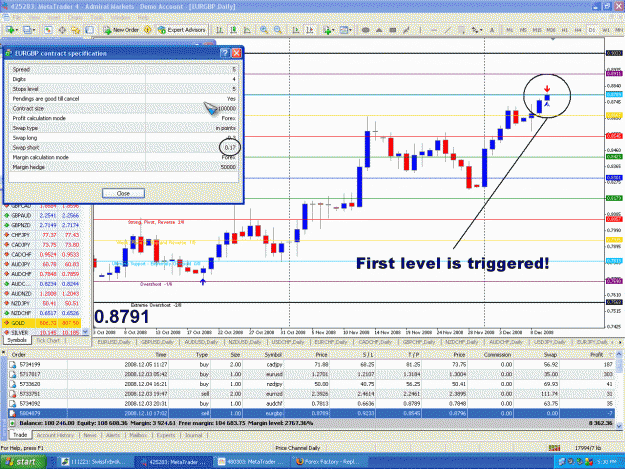
Eur/Gbp trade has reached the 8/8 Murrey and the first level was triggered. Only .17 on the swap short, but positive swap none the less.
Attached Image (click to enlarge)
Click to Enlarge

Name: murrey.gif
Size: 114 KB
 
 
  • Post #12
  • Quote
  • Dec 10, 2008 8:38pm Dec 10, 2008 8:38pm
  •  riskyachtar
  • | Joined Jul 2008 | Status: Trade to Life, life to trade | 330 Posts
look my chart
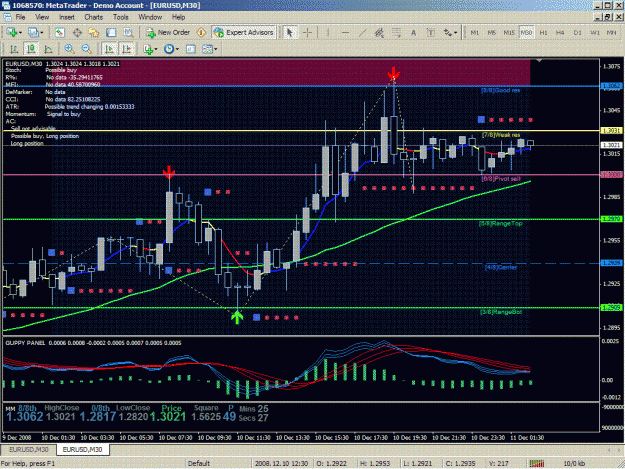
in tf30 chart eu in above +6/8 and below 7/8, i think eu will going up to +2/8

and indicator MML2 signal possible to long

Attached Image (click to enlarge)
Click to Enlarge

Name: 1.GIF
Size: 78 KB
 
 
  • Post #13
  • Quote
  • Dec 10, 2008 9:02pm Dec 10, 2008 9:02pm
  •  EAprogrammer
  • Joined Jul 2008 | Status: Professional EA programmer | 211 Posts
Interesting topic.
If everyone believes it, it will work.
 
 
  • Post #14
  • Quote
  • Dec 10, 2008 10:39pm Dec 10, 2008 10:39pm
  •  mer071898
  • Joined Jan 2007 | Status: Every new idea looks crazy at first | 1,620 Posts
Risky, here lies the problem with the lower timeframes. This pic is only a couple of hours later than your post and the Murrey lines have already changed! Now, when you hit the 8/8 murrey in you original chart and if you placed you TP where I do, you would have made 62 pips. But as you can see after the indicator changed, price is now pivoting off a major reversal point on the 30 minute charts. On the daily price is continuing to go up and the cool thing is the new 8/8 murrey line on the 30 minute chart is exactly where my TP is on my daily chart!
Attached Image (click to enlarge)
Click to Enlarge

Name: murrey.gif
Size: 53 KB
 
 
  • Post #15
  • Quote
  • Dec 10, 2008 11:30pm Dec 10, 2008 11:30pm
  •  riskyachtar
  • | Joined Jul 2008 | Status: Trade to Life, life to trade | 330 Posts
32-8-256 works on gbpusd but use 32-4-256 on eurusd and the like.

The reason I use these figures is so that the frame remains static (it does not double or half in size and simply moves up or down by an octave of its same size). I prefer it that way.

Daily = 4-64-256, 30Min = 32-8-256
Daily = 8-64-256, 30Min = 64-8-256

you can also use 20-8-256 on a 30min chart if you want to get closer to 65, 5days times 13 weeks = 65 or 1 quarter...13/5 = 2.6 x 8 = 20.8 = frame of 20, hence 20-8-256 Murrey(65) and 64-8-256 Gann(64)...you decide...I use 32-8-256
Attached Images (click to enlarge)
Click to Enlarge

Name: 1.GIF
Size: 93 KB Click to Enlarge

Name: 2.GIF
Size: 95 KB
 
1
  • Post #16
  • Quote
  • Dec 11, 2008 2:41am Dec 11, 2008 2:41am
  •  mer071898
  • Joined Jan 2007 | Status: Every new idea looks crazy at first | 1,620 Posts
Don't worry Risky, I wasn't saying your way wouldn't work or be profitable, just to cautious using smaller timeframes. If it works for you, great. I didn't start this thread to bash other traders, that's for sure. I'm just here to show everyone how I trade and appreciate any and all comments, thanks.
 
 
  • Post #17
  • Quote
  • Edited at 10:15am Dec 11, 2008 10:14am | Edited at 10:15am
  •  mer071898
  • Joined Jan 2007 | Status: Every new idea looks crazy at first | 1,620 Posts
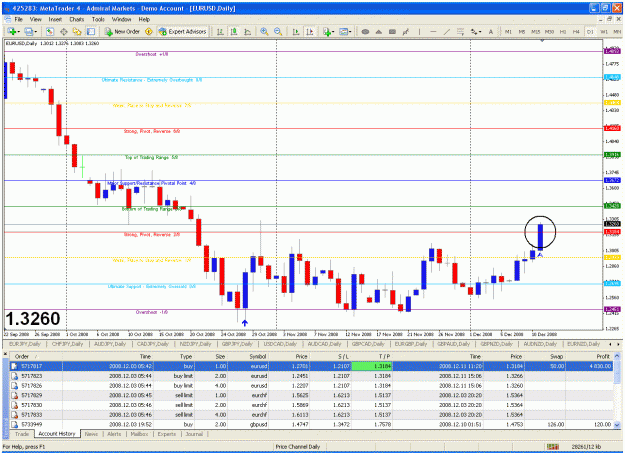
Just an update, our Eur/Usd closed out last night with a nice $4830.00 profit including an additional $50.00 in swap. Other trades are still going well and we will keep you all updated.
Attached Image (click to enlarge)
Click to Enlarge

Name: murrey.gif
Size: 53 KB
 
 
  • Post #18
  • Quote
  • Dec 12, 2008 3:53am Dec 12, 2008 3:53am
  •  mer071898
  • Joined Jan 2007 | Status: Every new idea looks crazy at first | 1,620 Posts
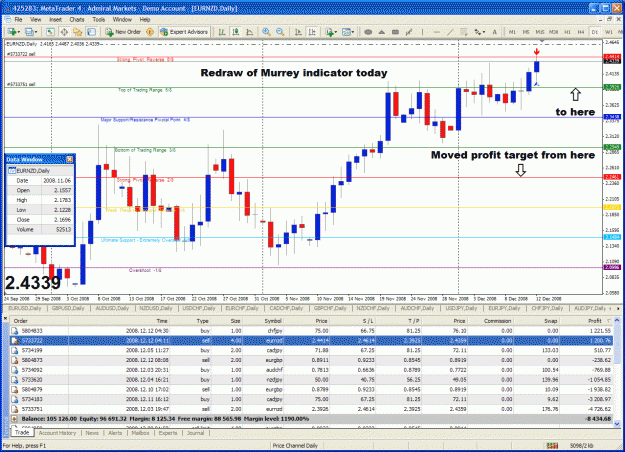
We had a redraw on Eur/Nzd today so I moved my original profit target from 2.2461 to 2.3926. We will let this ride until target is hit or stop is hit. If price falls just short of target I will probably close manually as long as both trades put together are in profit.
Attached Image (click to enlarge)
Click to Enlarge

Name: murrey.gif
Size: 84 KB
 
 
  • Post #19
  • Quote
  • Feb 11, 2009 2:02pm Feb 11, 2009 2:02pm
  •  rkhan
  • | Joined Jan 2009 | Status: Member | 1 Post
Quoting mer071898
Disliked
Risky, here lies the problem with the lower timeframes. This pic is only a couple of hours later than your post and the Murrey lines have already changed! Now, when you hit the 8/8 murrey in you original chart and if you placed you TP where I do, you would have made 62 pips. But as you can see after the indicator changed, price is now pivoting off a major reversal point on the 30 minute charts. On the daily price is continuing to go up and the cool thing is the new 8/8 murrey line on the 30 minute chart is exactly where my TP is on my daily chart!...
Ignored
Hi there, i really enjoyed reading your MM posts, i wanted to know how it is comming along?

I wanted to know, what time frames do you use it on?
Anybody used it on 15min timeframe?

Does anybody have some backtested results in an excel sheet or something?

Thanks
 
 
  • Post #20
  • Quote
  • Feb 12, 2009 2:51pm Feb 12, 2009 2:51pm
  •  BenQ
  • | Joined Jun 2006 | Status: Member | 1,050 Posts
I like trading daily MM lines, but so many of my swaps have changed in the last few months. Many that were once profitable to hold are now backwards, and some are negative in both directions.
 
 
  • Trading Systems
  • /
  • Murrey Math Swing Progression
  • Reply to Thread
    • Page 1 2
    • Page 1 2
0 traders viewing now
  • More
Top of Page
  • Facebook
  • Twitter
About FF
  • Mission
  • Products
  • User Guide
  • Media Kit
  • Blog
  • Contact
FF Products
  • Forums
  • Trades
  • Calendar
  • News
  • Market
  • Brokers
  • Trade Explorer
FF Website
  • Homepage
  • Search
  • Members
  • Report a Bug
Follow FF
  • Facebook
  • Twitter

FF Sister Sites:

  • Metals Mine
  • Energy EXCH
  • Crypto Craft

Forex Factory® is a brand of Fair Economy, Inc.

Terms of Service / ©2022