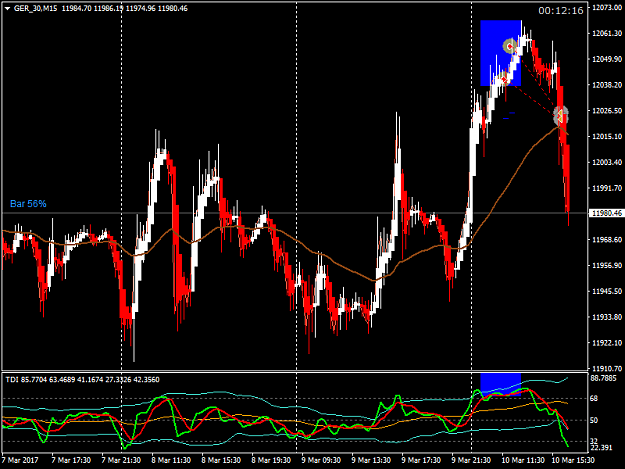
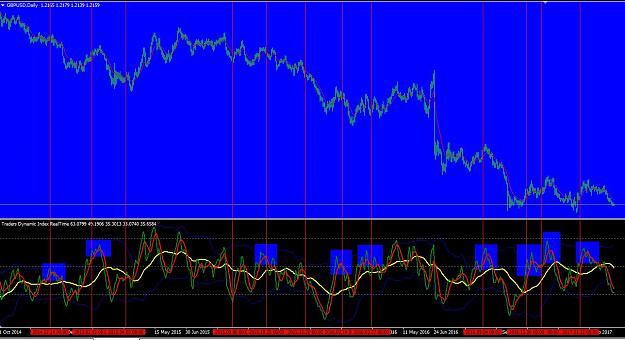
Hello folks, I'm new to the TMS system and have read Big E's PDF. I've been backtesting the H4 with a stop loss at the low of the current or previous candle and a R:R:R of 150%. I'm having limited success. Any advice would be appreciated. For the chart: The long lines followed by a check mark means the trade was successful and a short line followed by an X means the trade failed. {image}
Ignored
Thank you Tremulous.
This post the only post today worth reading.... 3 pages of posts tdoay since the last time I logged in.
my next post will say why.
Honesty is a very expensive gift. You wont find it in cheap people.WBuffett
{quote} Thank you Tremulous. This post the only post today worth reading.... 3 pages of posts tdoay since the last time I logged in. my next post will say why.
{quote} Hello luvene,can u tell me your opinion,i am en eurjpy long,gold short on D1 time frame,both in green pips,what would u do,will u close it today before NEWS,or u let trades open thru the weekend,both are in green pips.For some reason i cant share my charts... Thx for answerr
Ignored
Difficult to say, it depends. How many pips are you in profit right now on the EURJPY? I don't trade on Gold, I can't give you my opinion on that and please try to share a printscreen, it's much easier for me and others to give an opinion.
Keep it simple without too many crappy indicators!
{quote} Thanks.. these tools are vital. ... do you know of a diagonal buy/sell stop level? so not horizontal levels, I know those are available, if it's possible.. will post chart ..
Ignored
The segment lines drawn using MT4 line tool will work if they are named correctly for the EA to locate and use.
horizontal lines work, sloping lines also work.
I have mine trade manager EA to locate vertical line drawn where the bar close with TDI cross on higher TF D1 for the EA to locate that vertical line.
when the TDI cross Up, I name that vertical mine D1_Buy, and when the TDI cross down, I name that vertical line D1_Sell. The trade manager will check for these lines and use that for trade execution On/Off switch. Doing this, I can have my trade manager Ea running in H1 or H4 chart and do not have to look at D1 when trading.
I can post trade examples if I find time next week.
Honesty is a very expensive gift. You wont find it in cheap people.WBuffett
What happened here in the past 22 hours while I am gone? It was a long flight to get home, good to catch up with lost sleep and watching a few old movies. Finally got home, settle down and now caught up with reading 3 pages of posts since I went offline and to me it is 3 pages of waste of thread space.
Folks, why are some of you wasting your time bickering about things which you cannot change? You should be spending your time reading Big E posts, taking notes and writing your own system trading manual and also your trading business plan.
You can use Big E’ Post#647 as your trading checklist and make that into you trade plan document. I have provided you a generic template so use that if you can or if you have another better one, then please share it with us all here.
You should have spent the time and discuss your views and interpretation of Post#647 because that is important before your take any TDI cross and TDI bounce trade setups. I read nothing on trading discussion using Post#647. What I read is repeated quoting and re-quoting of Big E’ posts numbers. Reading old posts and repeating them is not trading. Trading is to look at live charts and share what you see and if there are trade opportunities to share and discuss. I read repeated subjective talking only by the same people with very little market trading experience and trying very hard to teach others trading made simple.
Tonight is NFP trading day. Why not spend time to discuss what you do on this day if you are trading intraday H1 and below, H4 trading and D1 chart trading etc.
This thread has become just fun and entertainment here in Forex Factory. Nothing serious focus into trading, sharing of knowledge and experience, and discussions while in live market.
Good luck folks, you need luck to make money when you do not develop your skills in trading.
Good night.
Honesty is a very expensive gift. You wont find it in cheap people.WBuffett
Hi guys and gals. I am a complete novice at this been self teaching over the last 6 months obviously I have lost a few thousand pounds by now and this is what has lead me hear. I am just wondering is this method still valid ? I have it set up and got opened a test account. Before trading I figured it would make a lot more sense to ask for any updates since there is 3000+ posts Many thanks in advance
Ignored
There are no update's. The method that BigE has started way back is still valued now as back then. Post#647 is the key to this method. It is what you do after the TDI gave a signal (cross) that count. You need to understand support / resistance. which direction the green is showing. What does angle 12/2, 4/6 mean. Candle's size and wick's length. Study the old chart's
{quote} I tried to analyze your logic. Green means I believe I know what you meant and red means I'm confused. I haven't looked at your attachments, but I will when I got the opportunity. {image}
Ignored
from your chart comments, I see you know price action ...
I can eliminate half of those 'x' you marked and you will have 50% fewer losing trade which means your win rate will improve.
Dont' need too deep analysis of the TDI cross which any way are derived from the price bar above. The price bar action and the momentum of the price change will decide the TDI Green and that depends on the RSI Price Type you use in the TDI setting. You want to see volatility other than just price momentum.
"Unlock the secrets of Indicators" is one seminar I attended recently and the speaker talked about the RSI too among several others like MACD, CCI, Stochastics,...
Honesty is a very expensive gift. You wont find it in cheap people.WBuffett
{quote} from your chart comments, I see you know price action ... I can eliminate half of those 'x' you marked and you will have 50% fewer losing trade which means your win rate will improve. Dont' need too deep analysis of the TDI cross which any way are derived from the price bar above. The price bar action and the momentum of the price change will decide the TDI Green and that depends on the RSI Price Type you use in the TDI setting. You want to see volatility other than just price momentum. "Unlock the secrets of Indicators" is one seminar...
Ignored
What do you mean by volatility? If there is weak price momentum, but strong volatility TMS stops working.
Also, is the Heikan Ashi price bar action/momentum better or worse than raw candlestick price bar action/momentum? I understand that the purpose of Heikan Ashi is to reduce the noise from raw candlesticks, but it seems like raw candlesticks would give you a better feel for the actual happenings of market (and also lead you astray due to noise).
Hey Folks, What happened here in the past 22 hours while I am gone? It was a long flight to get home, good to catch up with lost sleep and watching a few old movies. Finally got home, settle down and now caught up with reading 3 pages of posts since I went offline and to me it is 3 pages of waste of thread space. Folks, why are some of you wasting your time bickering about things which you cannot change? You should be spending your time reading Big E posts, taking notes and writing your own system trading manual and also your trading business plan....
{quote} What do you mean by volatility? If there is weak price momentum, but strong volatility TMS stops working. Also, is the Heikan Ashi price bar action/momentum better or worse than raw candlestick price bar action/momentum? I understand that the purpose of Heikan Ashi is to reduce the noise from raw candlesticks, but it seems like raw candlesticks would give you a better feel for the actual happenings of market (and also lead you astray due to noise).
Ignored
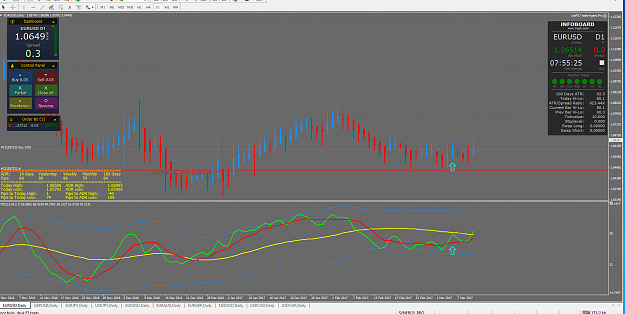
No offense but that's what I meant in the last two weeks. We are making it too difficult and complicated and we are thinking too much, me too! I don't want to do that anymore and don't remember, trading is not an exact science. Keep it simple and stupid. My way of trading is very easy and you know exactly where to enter a trade. Because of don't want to sit in front of my screen any longer I prefer to trade only on the Daily candle but of course if you like more action or you don't want to get bored, please be my guest and try it on the 15m / 1H / 4H. But I won't do that. The main is, keep it simple and use only TDI and Price Action HA candles.
Keep it simple without too many crappy indicators!
Hey Folks, What happened here in the past 22 hours while I am gone? It was a long flight to get home, good to catch up with lost sleep and watching a few old movies. Finally got home, settle down and now caught up with reading 3 pages of posts since I went offline and to me it is 3 pages of waste of thread space. Folks, why are some of you wasting your time bickering about things which you cannot change? You should be spending your time reading Big E posts, taking notes and writing your own system trading manual and also your trading business plan....
Ignored
Find your post offence and derogatorily. Reading your post you imply that you are only member that has enough knowledge to save us from destruction. Reading this book or that book is also not trading. Doing BPP and other stuff is not discussing Post#647. Will not voice an option about music and forest post's.
You say we must read BigE's posts and at the same time you say we must not quoting and re-quoting his post. How do you do a discussion on BigE post's with out quoting or re-quoting him. How do you help a member understand TMS with out using BigE's post's. As far as I understand the moment you use your own interpretation to help a member you take the focus away from TMS / TDI and place it on how you see and understand the market.
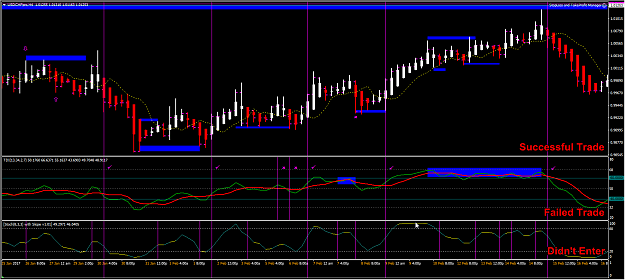
Taking the helpful input I received, I have updated my backtesting system and I tried to provide a reason for every trade I didn't take. (Of course hindsight is 20/20, but the idea is I improve my system.) If you see anything I missed or have a suggestion, please let me know.
Legend:
Blue rectangles on the candle chart indicates a support or resistance line.
Failed trades are short purple lines followed by an 'X' on the TDI.
Successful trades are the long purple lines followed by a check mark that cross all the charts.
Trades not taken are short purple lines on the Stochastic chart.
Blue rectangles on the TDI indicate a lack of confidence in the TDI.
{quote} Strat is one of my favourite professionl trader here in FF. He uses his own terminologies in his trading and trading. Big Boss = Monthly Boss = Weekly Worker = Daily we are TMS traders, we look at our trading charts TF, we look one TF higher that is our short term trend, another TF higher is the long term trend. so we have M15> H1> H4 H1 > H4 > D1 H4 > D1 > W1 Keep this simple, no need for new names.
Ignored
Hi Emmanuell,
and what about D1?
aka D1>W1>MN1 ?
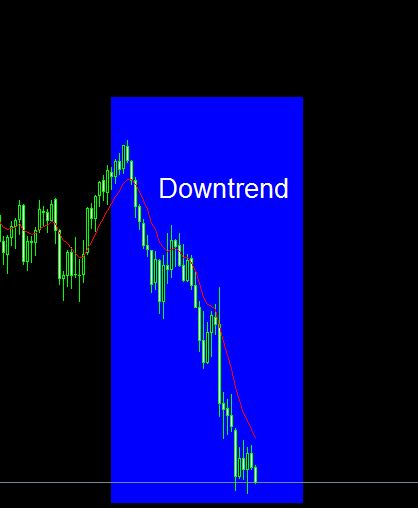
my view of trend definition is like this one:
this methode is for reversal mainly
first the monthly trend: we see and downtrend, price will be mostly under MA 10
Attached Image
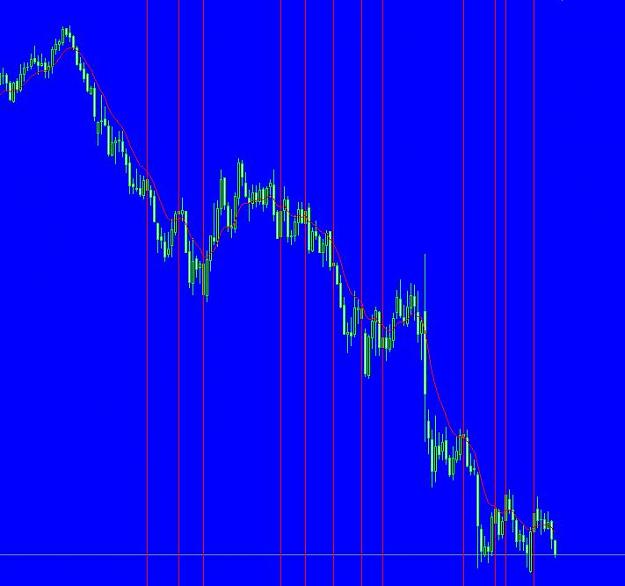
second there is the weekly, it's the same rectangle as above, I 've marked some zones where price retraced back to MA 10 and back again, sometimes price will go straight throug it, then I will not use that pair anymore(I also include PA as further confirmation, but thats written somewhere else....)
Attached Image (click to enlarge)
third there will be the daily chart, the marked zones are the same as above, I also marked the Zones when price will be in outside-bands-zone in the TDI and then crossed out of it. Together with SR-Zones/BRN/MA/Breakouts and so one I think they will be good chances to get into trades which can go for a long way...where you can build a fine position with MEME or trading SE/ME. Not all zones will went into the green but I think they are good possibility.
Attached Image (click to enlarge)
otherwise when I look for continuation/bounce-trades I'm looking that monthly/weekly and daily will be all under EMA 10 for my confirmation of the trading direction.
What do you think about this? Does it make sense in your opinion?
Taking the helpful input I received, I have updated my backtesting system and I tried to provide a reason for every trade I didn't take. (Of course hindsight is 20/20, but the idea is I improve my system.) If you see anything I missed or have a suggestion, please let me know. Legend: Blue rectangles on the candle chart indicates a support or resistance line. Failed trades are short purple lines followed by an 'X' on the TDI. Successful trades are the long purple lines followed by a check mark that cross all the charts. Trades not taken are short...
Ignored
the lack of confidence in the TDI is that it gets scrambled when you are in an uptrend
Joined Jun 2013
|
Status: Membership Rewarded
|3,206 Posts
Hi traders..
Im a bit playing with the MEME stuff with small sizes
The div. + first cross TDI and first candle colour change was my entry..
Before the volabands got touched.. what I really like !
.. building positions by grid ... TP was my loved 50 Ema .
Without muli entry , this would be a losing trade , because my " SL " had been above last 2-3 candles high .
Milked 47 pips out of the M15 dax today
The coming weeks and months, I try to collect confidence+ experience with this style of moneymanagement ..
Stay tuned + a nice weekend @ all