• Home
  • Forums
  • Trades
  • News
  • Calendar
  • Market
  • Brokers
  • Login
  • Join
  • User/Email: Password:
  • 11:58pm
Menu
  • Forums
  • Trades
  • News
  • Calendar
  • Market
  • Brokers
  • Login
  • Join
  • 11:58pm
Sister Sites
  • Metals Mine
  • Energy EXCH
  • Crypto Craft

Options

Bookmark Thread

First Page First Unread Last Page Last Post

Print Thread

Similar Threads

MT4: how to change "EURUSD" to "#EURUSD"? 3 replies

Re: EurUsd short term 15 replies

did oanda just drop its spread for eurusd to 1 pip? 11 replies

EA for multiple lot limit order for EURUSD 0 replies

NFP nice bump up on EURUSD 2 replies

  • Interactive Trading
  • /
  • Reply to Thread
  • Subscribe
  • 168,522
Attachments: EURUSD
Exit Attachments
Tags: EURUSD
Cancel

EURUSD

  • Last Post
  •  
  • 1 5477354774Page 547755477654777 61024
  • 1 Page 54775 61024
  •  
  • Post #1,095,481
  • Quote
  • Mar 9, 2017 1:29pm Mar 9, 2017 1:29pm
  •  Don96
  • Joined Dec 2015 | Status: Member | 7,795 Posts
Quoting pkimnyc
Disliked
{quote} I use same thing you use. Lagging indicator called macd. /r
Ignored
Oh, first answer I have as momentum but how does Macd show momentum ?
 
 
  • Post #1,095,482
  • Quote
  • Mar 9, 2017 1:31pm Mar 9, 2017 1:31pm
  •  pkimnyc
  • Joined Oct 2007 | Status: Sniper | 14,763 Posts
Quoting Don96
Disliked
{quote} Oh, first answer I have as momentum but how does Macd show momentum ?
Ignored
see the chart compare with price, you will see.
 
 
  • Post #1,095,483
  • Quote
  • Mar 9, 2017 1:34pm Mar 9, 2017 1:34pm
  •  Teek
  • Joined Feb 2017 | Status: pippin' | 1,139 Posts
Quoting Ata-Turkoglu
Disliked
H1 Chart Update Triangle forming. The thick red and blue edges I marked will probably push price into a narrow range soon. Meaning: more boring and confusing days are coming. The horizontal angle of 200 EMA on H4 supports the idea that we will face a long lasting boring phase of sideways priceaction which will be profitable for swing traders. My humble opinion. I will try to trade this triangle range on H1 or smaller timeframes. Simply I will look for short opportunities whenever price nears blue thick line and vice versa when it nears red thick...
Ignored
Hard to believe it can become more boring than it already is, but I think you are right.
We'll continue the sidewalk between 1.060-1.052 and getting tighter by the day.
you are not expected to understand this
 
2
  • Post #1,095,484
  • Quote
  • Mar 9, 2017 1:35pm Mar 9, 2017 1:35pm
  •  vecher
  • | Joined Jun 2010 | Status: Member | 13 Posts
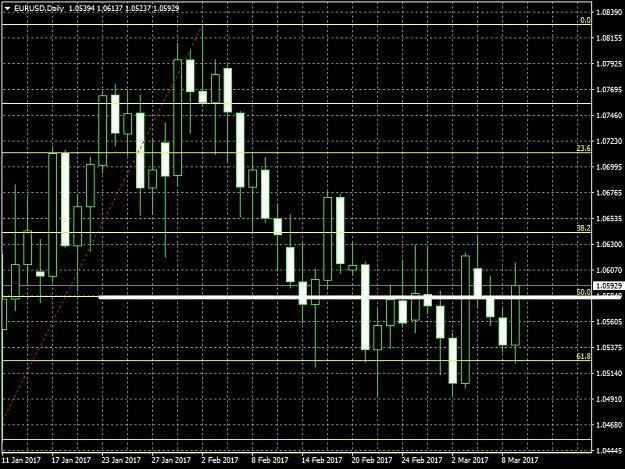
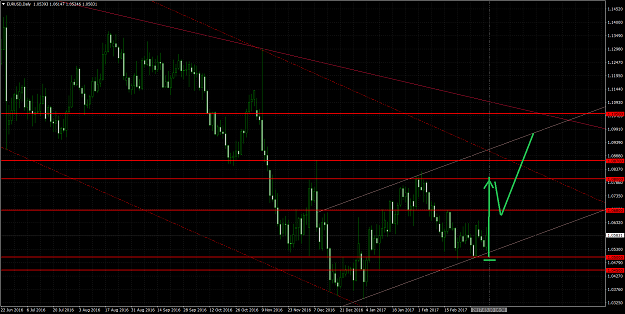
rate hike almost done deal, its priced in, so i prefer bull side for next weeks
its a gamble but i place small buy limit 1.0505 sl 1.0460 tp 1.0790
Attached Image (click to enlarge)
Click to Enlarge

Name: EURUSDDaily09.03.png
Size: 70 KB
 
2
  • Post #1,095,485
  • Quote
  • Mar 9, 2017 1:37pm Mar 9, 2017 1:37pm
  •  pkimnyc
  • Joined Oct 2007 | Status: Sniper | 14,763 Posts
Quoting Don96
Disliked
{quote} Oh, first answer I have as momentum but how does Macd show momentum ?
Ignored
Besides... whichever indicator or whatever you feel comfortable with, stick with it. they all do same thing.
It's not just indicator you need to rely on anyway. there are other factors to consider.
Stick with one and study them then you will get the idea.
 
 
  • Post #1,095,486
  • Quote
  • Mar 9, 2017 1:38pm Mar 9, 2017 1:38pm
  •  frx_trader
  • | Joined Jun 2012 | Status: Analyst | 3,688 Posts
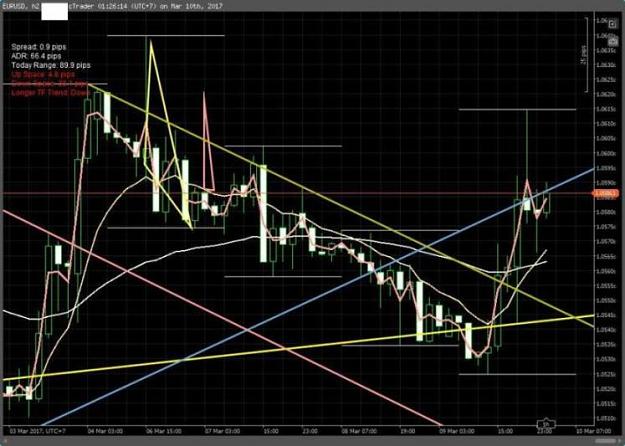
EU 2hrs. Yellow lines form triangle. Cuurent trend : Blue line. Note : Pink tracking curve and zigzag.
Attached Image (click to enlarge)
Click to Enlarge

Name: cT_cs_2026480_EU_2017-03-09_14-52-59.JPG
Size: 59 KB
 
 
  • Post #1,095,487
  • Quote
  • Mar 9, 2017 1:46pm Mar 9, 2017 1:46pm
  •  SteFX85
  • Joined May 2015 | Status: Member | 1,148 Posts
Quoting SteFX85
Disliked
80 pip target long for tomorrow? Or are we going down further. I'm seeing flags Downwave 2 is holding for now. Some timing... {image}
Ignored
Damn I missed this trade.
What's that smell? ---- I smell money!
 
 
  • Post #1,095,488
  • Quote
  • Mar 9, 2017 1:50pm Mar 9, 2017 1:50pm
  •  yanitsa
  • | Joined Sep 2013 | Status: Member | 2,240 Posts
EUR is in the mide of the rally from 03 january .
It is so undecided , that even God does not want to trade it .
 
 
  • Post #1,095,489
  • Quote
  • Mar 9, 2017 1:55pm Mar 9, 2017 1:55pm
  •  yanitsa
  • | Joined Sep 2013 | Status: Member | 2,240 Posts
Still short bias
Attached Image (click to enlarge)
Click to Enlarge

Name: EURUSDDailystillshort.jpg
Size: 202 KB
 
2
  • Post #1,095,490
  • Quote
  • Mar 9, 2017 1:59pm Mar 9, 2017 1:59pm
  •  frx_trader
  • | Joined Jun 2012 | Status: Analyst | 3,688 Posts
Quoting yanitsa
Disliked
Still short bias {image}
Ignored
We'll see if this rally reaches this week highest.
 
 
  • Post #1,095,491
  • Quote
  • Mar 9, 2017 2:12pm Mar 9, 2017 2:12pm
  •  Ata-Turkoglu
  • Joined May 2014 | Status: Full Time Trader | 20,371 Posts
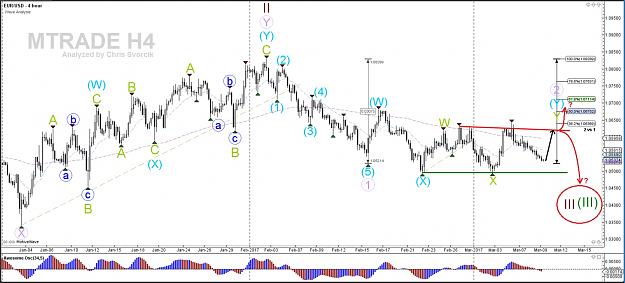
H4 Chart Update from Mtrades.com

On the bigger picture price seems to be inside the last bullish leg of a wave 2.. Once this is complete bears should continue to trade south. I added the red arrows to the chart to show my thinking. Connect this chart with my hourly chart and you will understand why daily close above 1.0630/40 zone is very important for bulls.

Keep also in mind that wave 2 or wave 4 type of retracements often are very annoying. They require extreme patience and focus. Many pro traders don't even trade these 2 dangerous waves. Many traders lose their money especially during the choppy actions of these waves. Therefore we need patience until bulls are completely done. Best is to stay out or trade ultra focused like a ninja. Hit and run style.. lol

Good luck.. and Stay Green
Attached Image (click to enlarge)
Click to Enlarge

Name: EU-09-March-2017-H4.jpg
Size: 239 KB
Be a seer, not a looker!
 
1
  • Post #1,095,492
  • Quote
  • Mar 9, 2017 2:42pm Mar 9, 2017 2:42pm
  •  ruma29
  • | Membership Revoked | Joined Aug 2015 | 1,243 Posts
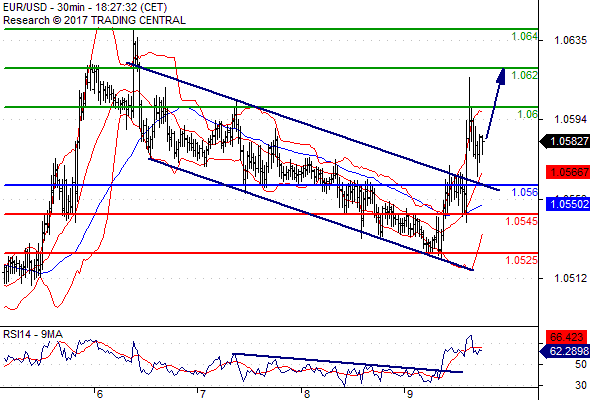
Title:EUR/USD Intraday: the bias remains bullish.
Summary:Long positions above 1.0560 with targets at 1.0600 & 1.0620 in extension.
Story:Pivot: 1.0560

Our preference: long positions above 1.0560 with targets at 1.0600 & 1.0620 in extension.

Alternative scenario: below 1.0560 look for further downside with 1.0545 & 1.0525 as targets.

Comment: the RSI broke above a declining trend line. The pair broke above a declining channel and is approaching a rebound off the upper bound of the channel.

Supports and resistances:
1.0640 *
1.0620 **
1.0600 **
1.0584 Last
1.0560 ***
1.0545 **
1.0525 **

Copyright 1999 - 2017 TRADING CENTRAL
Attached Image
 
 
  • Post #1,095,493
  • Quote
  • Mar 9, 2017 2:44pm Mar 9, 2017 2:44pm
  •  awm
  • | Joined Nov 2016 | Status: Member | 58 Posts
Quoting Teek
Disliked
{quote} Hard to believe it can become more boring than it already is, but I think you are right. We'll continue the sidewalk between 1.060-1.052 and getting tighter by the day.
Ignored
May be wise to stand back for a few days... Especially as we approach the weekend.
 
2
  • Post #1,095,494
  • Quote
  • Mar 9, 2017 3:02pm Mar 9, 2017 3:02pm
  •  Teek
  • Joined Feb 2017 | Status: pippin' | 1,139 Posts
Quoting awm
Disliked
{quote} May be wise to stand back for a few days... Especially as we approach the weekend.
Ignored
Wise words! I don't trade this. I wait...

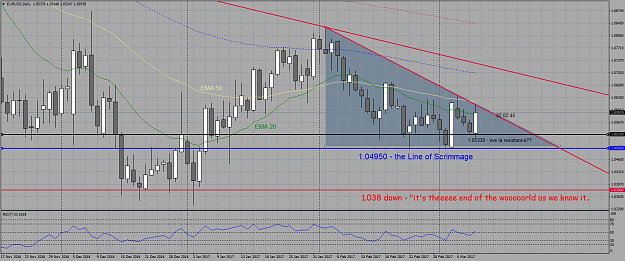
An intense look at the DAILY.
It sais it all... really


"Everyone deep in their hearts is waiting for the end of the world to come"
~ Haruki Murakami
Attached Image (click to enlarge)
Click to Enlarge

Name: EURUSDDaily.png
Size: 96 KB
you are not expected to understand this
 
1
  • Post #1,095,495
  • Quote
  • Mar 9, 2017 3:02pm Mar 9, 2017 3:02pm
  •  Don96
  • Joined Dec 2015 | Status: Member | 7,795 Posts
Quoting ruma29
Disliked
Title:EUR/USD Intraday: the bias remains bullish. Summary:Long positions above 1.0560 with targets at 1.0600 & 1.0620 in extension. Storyivot: 1.0560 Our preference: long positions above 1.0560 with targets at 1.0600 & 1.0620 in extension. Alternative scenario: below 1.0560 look for further downside with 1.0545 & 1.0525 as targets. Comment: the RSI broke above a declining trend line. The pair broke above a declining channel and is approaching a rebound off the upper bound of the channel. Supports and resistances: 1.0640...
Ignored
what is copyrighted?
 
 
  • Post #1,095,496
  • Quote
  • Mar 9, 2017 3:07pm Mar 9, 2017 3:07pm
  •  Don96
  • Joined Dec 2015 | Status: Member | 7,795 Posts
also what is so bullish about the speech?
 
 
  • Post #1,095,497
  • Quote
  • Mar 9, 2017 3:13pm Mar 9, 2017 3:13pm
  •  ruma29
  • | Membership Revoked | Joined Aug 2015 | 1,243 Posts
Quoting Don96
Disliked
{quote} what is copyrighted?
Ignored
chart is created by trading central...user cannot claim as it his/her or sell it..its name must be there...something like that
 
 
  • Post #1,095,498
  • Quote
  • Mar 9, 2017 3:16pm Mar 9, 2017 3:16pm
  •  Don96
  • Joined Dec 2015 | Status: Member | 7,795 Posts
if things work in the 'symmetry' definition in trading... 1.0530x is the support mirrored number as 1.0610 on that move...

1.0714/1.0698 still there.. i posted it some time back, cant find it, well haven't looked. i still favour the move to 1.0400x/26x with 1.0610 being the limit of the move before it happens. larger scale 1.0657/68 is the better entry for 1.04xxx numbers... that high isn't required... Q resistance kept it in check... all on track
 
 
  • Post #1,095,499
  • Quote
  • Mar 9, 2017 3:18pm Mar 9, 2017 3:18pm
  •  Don96
  • Joined Dec 2015 | Status: Member | 7,795 Posts
Quoting ruma29
Disliked
{quote} chart is created by trading central...user cannot claim as it his/her or sell it..its name must be there...something like that
Ignored
oh, do you have much association with them?

i doubt that they would win a case should someone put those same indicators on and have the same idea... removing the name would be enough

anyway, do you know what was so bullish about the speech? or was it just the PA?
 
 
  • Post #1,095,500
  • Quote
  • Mar 9, 2017 3:29pm Mar 9, 2017 3:29pm
  •  wukatrades
  • | Joined Jan 2017 | Status: Thinker | 386 Posts
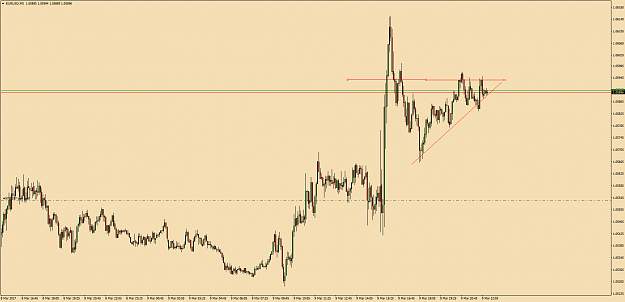
Ascending Triangle anyone? GO BULLS GO!!!! sorry useless post lol just trying to test out attaching images.
Attached Image (click to enlarge)
Click to Enlarge

Name: Ascending Triangle.png
Size: 57 KB
 
 
  • Interactive Trading
  • /
  • EURUSD
  • Reply to Thread
    • 1 5477354774Page 547755477654777 61024
    • 1 Page 54775 61024
3 traders viewing now
  • More
Top of Page
  • Facebook
  • Twitter
About FF
  • Mission
  • Products
  • User Guide
  • Media Kit
  • Blog
  • Contact
FF Products
  • Forums
  • Trades
  • Calendar
  • News
  • Market
  • Brokers
  • Trade Explorer
FF Website
  • Homepage
  • Search
  • Members
  • Report a Bug
Follow FF
  • Facebook
  • Twitter

FF Sister Sites:

  • Metals Mine
  • Energy EXCH
  • Crypto Craft

Forex Factory® is a brand of Fair Economy, Inc.

Terms of Service / ©2023