Finding it too difficult to ignore trading during the morning (GMT). So researching if there are any viable options whilst waiting for US markets to open.
The FTSE on SB suffers too large a spread for each typical move, so that is out. It also requires ICE data at $110 a month with Futures trading.
The Dax simply does too many impulse moves on every single scale to be worth watching (imo). Occasionally it trends nicely, but 'occassionally', is not good enough, as boredom sees too many wrong trades or too much time spent watching and not trading. It encourages mistakes. (again just imho).
The EU does appear to throw up a few good set-ups, but again, it doesn't move enough points unless something newsworthy is happening currently in the real world to cause some volatility. The problem then is, that volatility can become a little less predictable and dangerous.
That leaves the UJ as my other short list candidate and probably the most likely to give both enough corrective moves (for the choppy pullbacks we need), combined with just about enough points to cover the spread and make it worthwhile.
Still not ideal, compared to Futures, but as i say, for GMT morning trading, if you have to do something, i think it is the pick of the bunch.
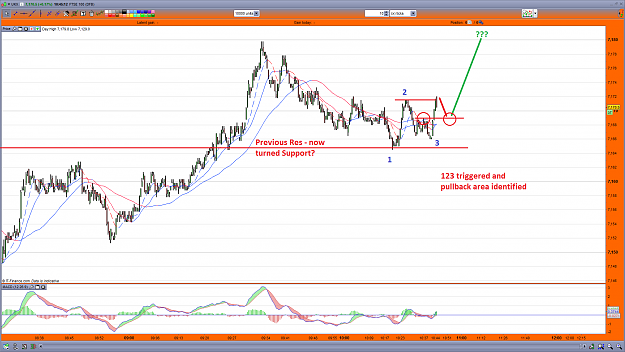
Now here's the thing, this needs to be tested out for far longer yet, to see how it plays out, but i reckon it has a habit of using prior S/R points from previous subwave, then to it's current subwaves.
How can i simplify that statement and explain it properly?
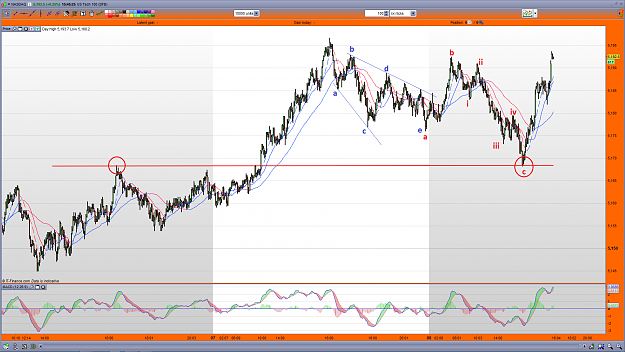
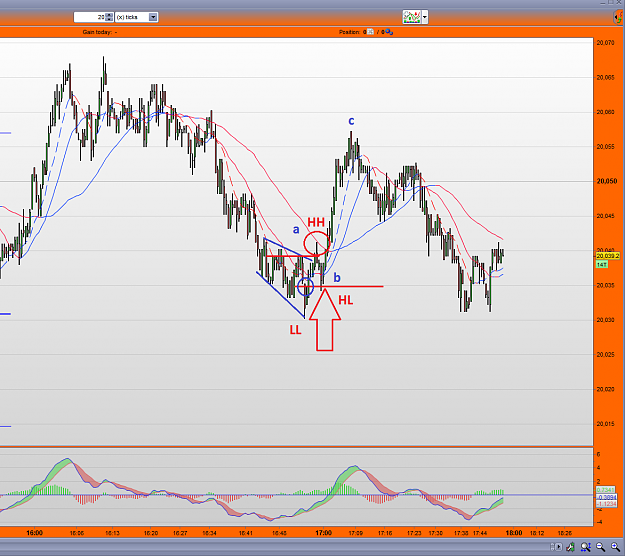
Ok so here is a chart of the Uj from this morning;

Hopefully, you can grasp what i mean. The blue lines would be the pullback to subwave (i) of each cycle, however, it virtually never connected to one of those all morning, whereas, if you look at the red lines - each time the prior peak of a sub cycle was retested and gives a good reaction. Ok, sometimes there is slight carry through to allow for regarding stops and it is in hindsight, thus it takes some getting used too to try and mechanicalise the method, however.... there are some canny trades in amongst that chart...
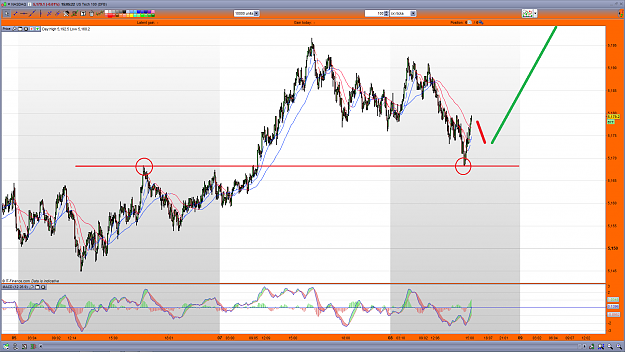
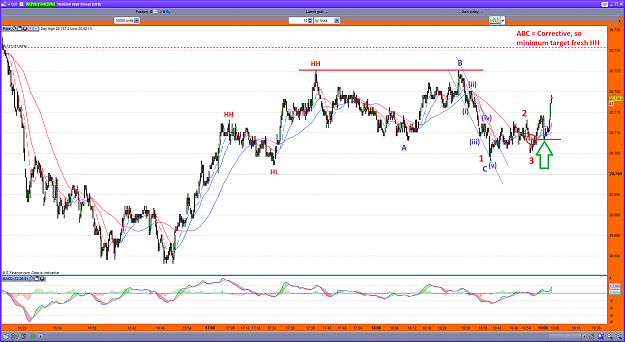
I still can not help but see each 123 trigger as (at that stage) possible abc corrective, so i am still tweaking as to how to play that. For me it is safer when there is a minmum 3 peaks to confirm trend, however, the move down to the right of the chart from the top, (red circle), looked exactly to me as a 5w move, (blue channels) with an irregular 'b' wave, thus i was expecting a decent fall, (remember what i said about 'irregular' 'b' waves? expect a strong ensuing move with underlying trend). The retest was pinpoint perfect and some strong red candles follwed up... Nice!
The FTSE on SB suffers too large a spread for each typical move, so that is out. It also requires ICE data at $110 a month with Futures trading.
The Dax simply does too many impulse moves on every single scale to be worth watching (imo). Occasionally it trends nicely, but 'occassionally', is not good enough, as boredom sees too many wrong trades or too much time spent watching and not trading. It encourages mistakes. (again just imho).
The EU does appear to throw up a few good set-ups, but again, it doesn't move enough points unless something newsworthy is happening currently in the real world to cause some volatility. The problem then is, that volatility can become a little less predictable and dangerous.
That leaves the UJ as my other short list candidate and probably the most likely to give both enough corrective moves (for the choppy pullbacks we need), combined with just about enough points to cover the spread and make it worthwhile.
Still not ideal, compared to Futures, but as i say, for GMT morning trading, if you have to do something, i think it is the pick of the bunch.
Now here's the thing, this needs to be tested out for far longer yet, to see how it plays out, but i reckon it has a habit of using prior S/R points from previous subwave, then to it's current subwaves.
How can i simplify that statement and explain it properly?
Ok so here is a chart of the Uj from this morning;
Attached Image (click to enlarge)
Hopefully, you can grasp what i mean. The blue lines would be the pullback to subwave (i) of each cycle, however, it virtually never connected to one of those all morning, whereas, if you look at the red lines - each time the prior peak of a sub cycle was retested and gives a good reaction. Ok, sometimes there is slight carry through to allow for regarding stops and it is in hindsight, thus it takes some getting used too to try and mechanicalise the method, however.... there are some canny trades in amongst that chart...
I still can not help but see each 123 trigger as (at that stage) possible abc corrective, so i am still tweaking as to how to play that. For me it is safer when there is a minmum 3 peaks to confirm trend, however, the move down to the right of the chart from the top, (red circle), looked exactly to me as a 5w move, (blue channels) with an irregular 'b' wave, thus i was expecting a decent fall, (remember what i said about 'irregular' 'b' waves? expect a strong ensuing move with underlying trend). The retest was pinpoint perfect and some strong red candles follwed up... Nice!
GoFundMe -stage-4-glioma-brain-cancer-fighter (link in my profile)