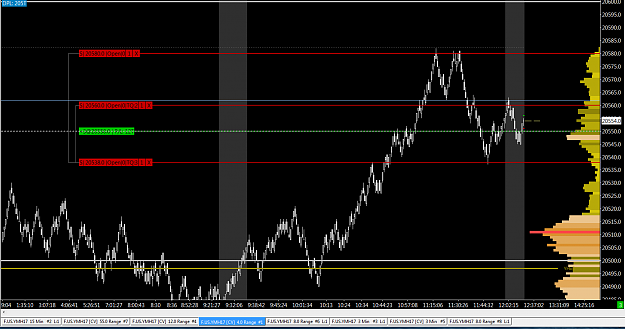
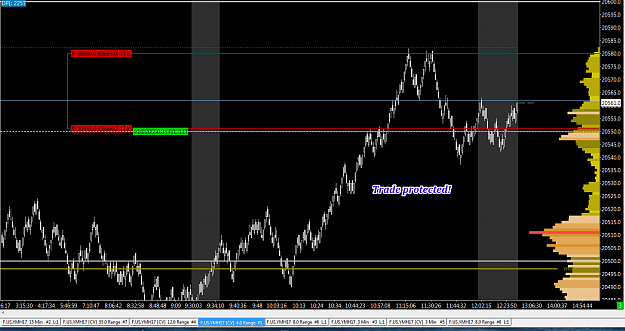
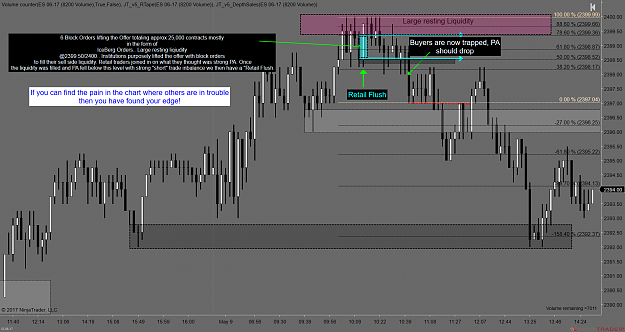
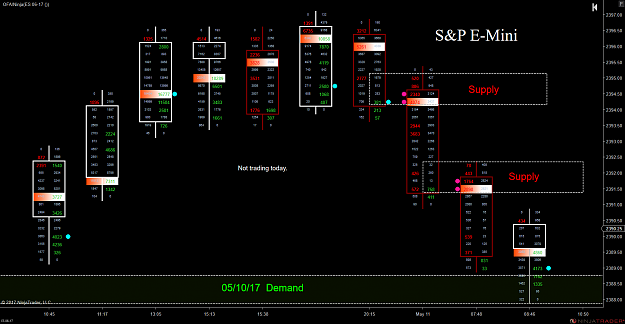
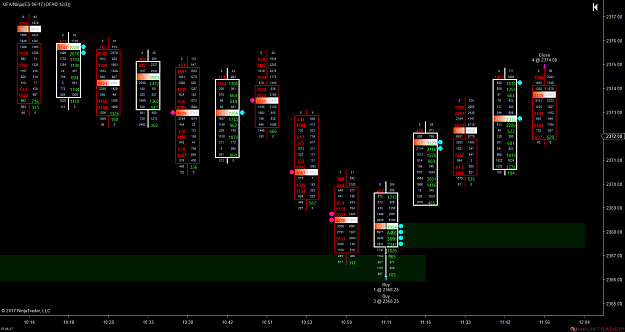
Disliked{quote} Hi Jmezz, a perfect example of how I use the OFA footprint charts is I look for a trade Imbalance with momentum with a series of blue or pink dots. This can signal strong support/resistance when PA returns. If however we see strong buying Imbalance then retracing below this area with a short trade Imbalance then we have a retail flush. YM 12-16 ( OFA14_3 ) 10_27_20161.jpg;2184319 6B 12-16 ( OFA
Ignored
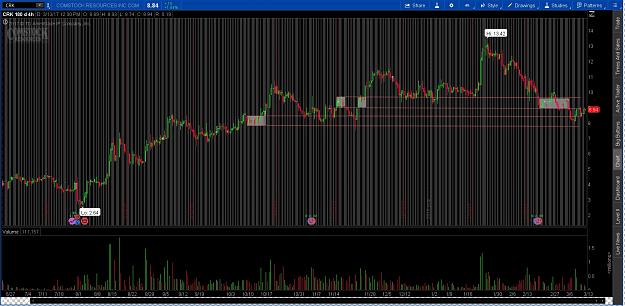
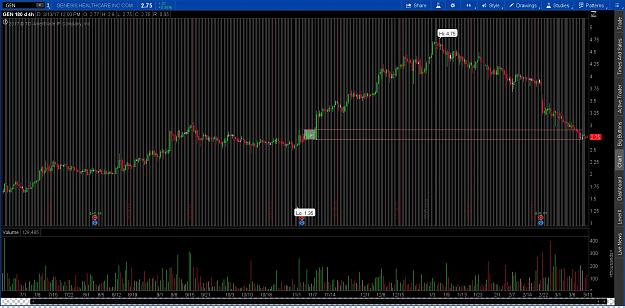
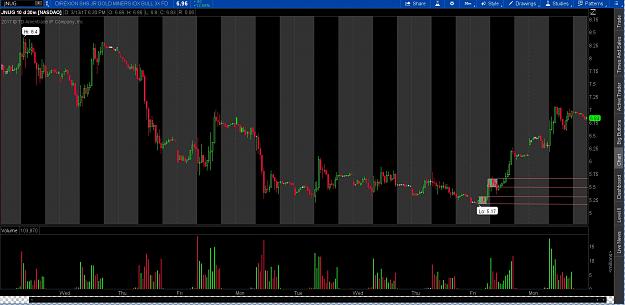
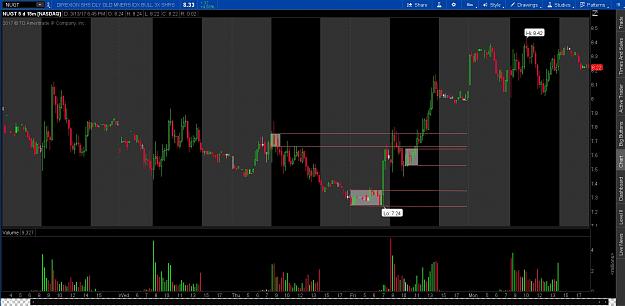
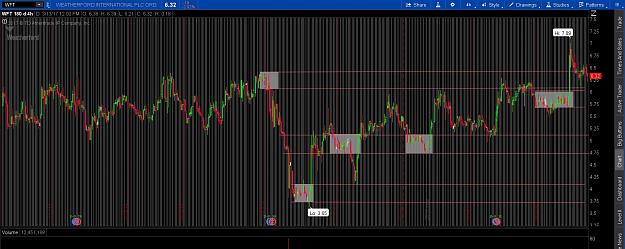
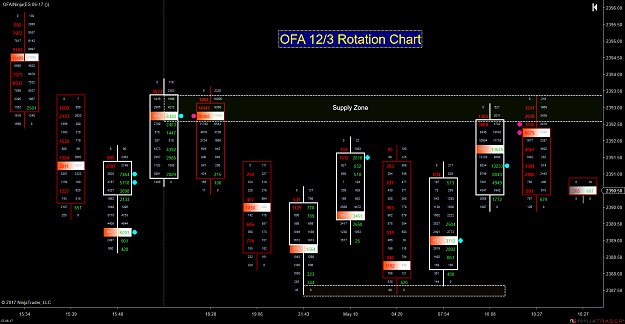
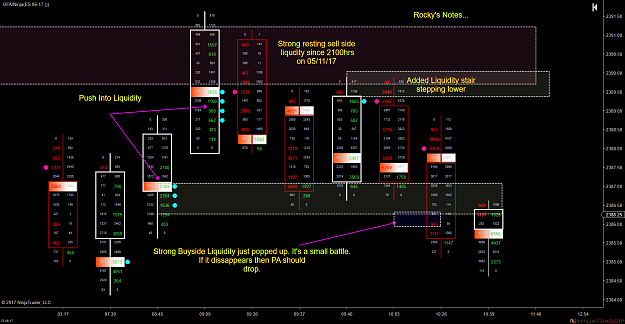
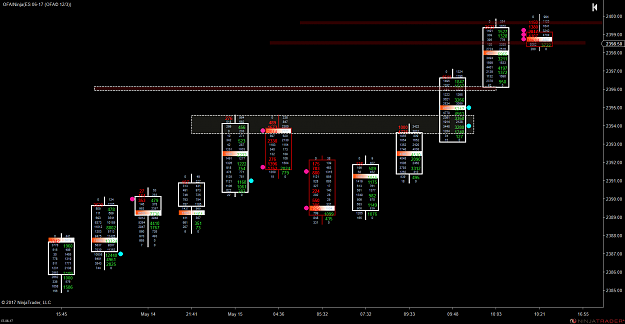
Looking at footprint afterhours, I see more instances where price comes down and respects the highest volume node and also large volume blocks.
Unfortunately my chart doesn't have the imbalance momentum circles that yours does but looks like there is still value to be gleaned in the large volume blocks.