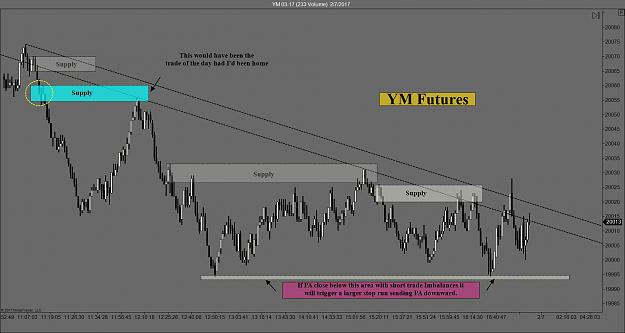
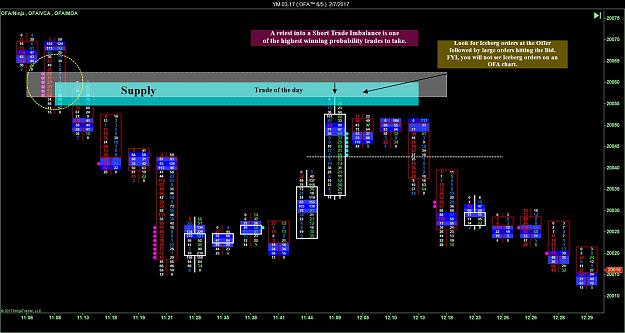
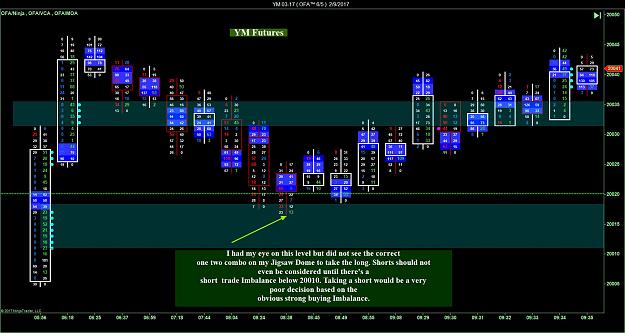
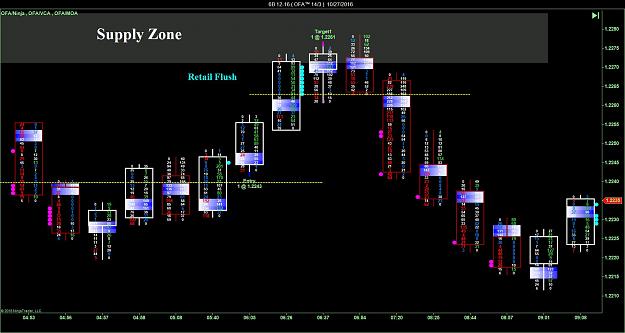
Disliked{quote} Anatman, The supply zone on the OFA chart was solely based on what I saw in the structure on the 233 tick chart. When PA enters my area of Interest It's then that I flip over to the Jigsaw tools/OFA charts for possible entries.Ignored
Couple of questions if I may please Rocky when you get a moment:
a) You said earlier "Also, make sure there's strong (Offer) Liquidity in the .786 fib zone" are you referring to the jigsaw DOM limit orders and looking for what Peter Davies refers to as "Thicker liquidity at support/resistance areas" ie thicker "stacked" limit offers in that area on the DOM relative to surrounding areas. I assume you expand your DOM levels to go as high up/low down as possible?
b) Quick question regarding your setup. I know from previous posts you have 3 x 27" monitors I was wondering if you have up say for ES for example one chart for longer term (eg 240/720 min etc) and a separate one for shorter term (eg Tick/Volume) or whether you do both analysis on one chart. I know everyone is different but was just wondering out of curiosity how you did it - all on one chart or split your longer term/shorter term onto separate charts of the same instrument.
Thanks you very much!!!!