{quote} Does it also need the SWISSEPH.mqh file? Where can one get a recent SWISSEPH.mqh file?
Ignored
Yes. All the usual files for the Swiss ephemeris are needed. I think a recent version of SWISSEPH.mqh is not needed, the old one should work. The problems before occurred only with the astro-swiss.mq4, but I managed to hack that together here.
Cheers,
k
Edit: here is the one I have (It goues into the Include folder, not the Indicators folder of the MT4):
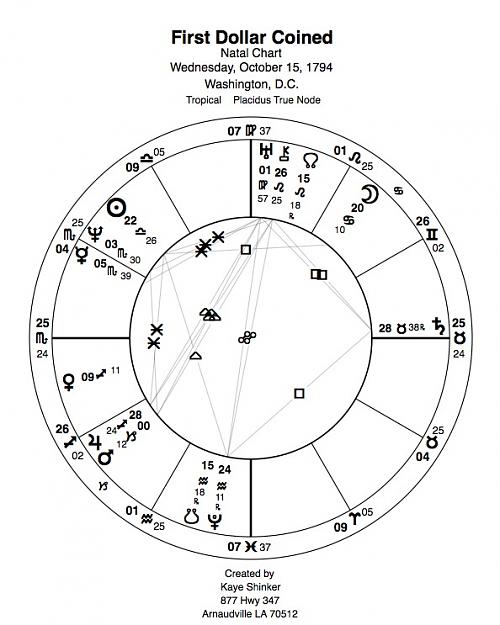
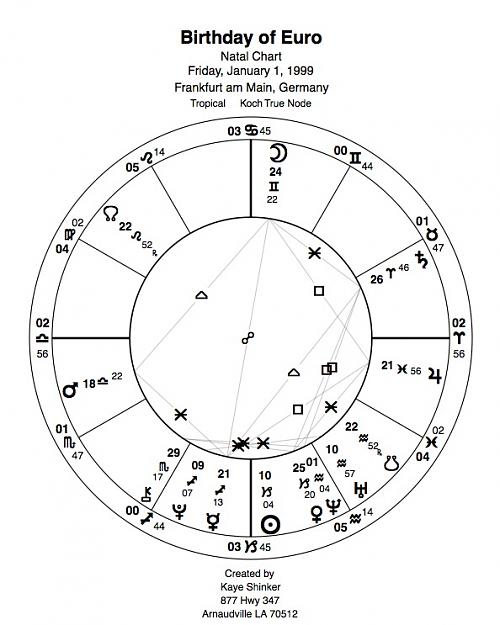
{quote} Thanks Suryananda for your sharing about medieval and vedic astrology. How about Lal Kitab? http://www.lalkitab.in/ It is kind of "branch" of Vedic astrology? Below are Birthday chart for EUR and Dollar Currency from http://astrologicalinvesting.blogspot.com/ I found those chart are usefull. can u suggest the birtday chart for pound.. thanks {image} {image}
Ignored
These are the charts for Euro & Dollar but how is someone support to trade EUR/USD with this?
Would you say using these charts one should stick with Euro Future contracts & dollar future contracts for the system to be effective at all??
thanks for your shares - how do you use these indicators for the determination of intraday highs or lows ?
Are my eyes to "old" that i don`t see any profitable use of it ?
I miss the indicator shared from bongo bongoo more than one year ago - see posts #6589 + #6591.
If i remember correctly, you must click at the last low/high to get it working.
kprsa, thanks for your shares - how do you use these indicators for the determination of intraday highs or lows ? Are my eyes to "old" that i don`t see any profitable use of it ? I miss the indicator shared from bongo bongoo more than one year ago - see posts #6589 + #6591. If i remember correctly, you must click at the last low/high to get it working. Sixer {image} {file}
Ignored
Hi Sixer,
The idea behind the indicators that I'm sharing is to try to determine a plausible physical mechanism for observed effects, like the effect of lunar cycle in stocks.
I approach this from the point of view of a skeptic: For example to me there is absolutely no reason why Saturn-trine-Jupiter would have any effect on the stock market. However, if there is an observed effect, an effort should be made to search for the possible mechanism of influence. Hence these indicators. Some of these can be found built in other specialized software packages. Some are hopefully original.
I do not claim to use these indicators in my everyday trading, I do not claim to have success with them, and I do not claim I would share the indicators I would have success with.
With this out of the way, usually the idea behind the cycle calculation is to find if the financial instrument correlates with the calculated cycle, in order to pinpoint possible reversals. I guess the typical usage would be given in jnevins'es post here (edit: or Chris Moody's post on TradingView forum here). Most of the cycles will occur on the higher timescale than the intraday, the lunar cycle is 29.53 days, the Earth rotation cycle around the Sun is 365.25 days. The equilibrium tide cycles can be used for intraday trading since at moderate latitudes there will be two tides per day.
Edit: I do not understand what the situation is with the indicator by bingo bongoo. Certainly its source hasn't been shared (it is an ex4 file), so it cannot be verified or edited.
Thanks for your thoughts - add my to the sceptical users of these "explanations" too.
I hope we can find a good cracker to get the code of the Hurst cycle indicator.
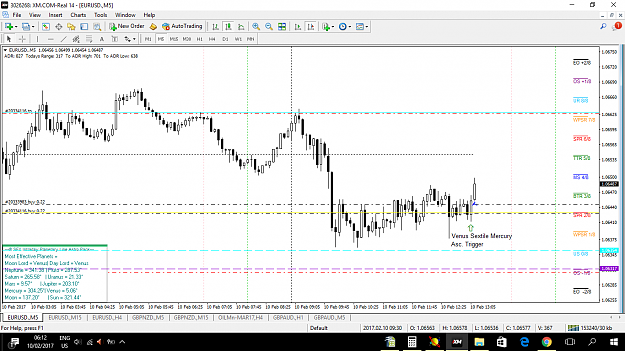
The actual Intermediate Delta count shows an irregular flat price pattern between the ITD-7 high and ITD-8 low.
It seems that the Finance Mafia is acting in the same manner as at the end of 2016.
{quote} Yes. All the usual files for the Swiss ephemeris are needed. I think a recent version of SWISSEPH.mqh is not needed, the old one should work. The problems before occurred only with the astro-swiss.mq4, but I managed to hack that together here. Cheers, k Edit: here is the one I have (It goues into the Include folder, not the Indicators folder of the MT4): swisseph.mqh;2179025 {file}
Ignored
Thanks.
Well have it compiled with the mqh file and downloaded the swedll file and installed it. Indi shows up in window but no indi display. Anyone have any suggestions? I am getting a number for the acceleration calc showing but no visual lines. Not sure if the calculated number is right either, it changed for earth/moon and others so assuming it's right. Colors should not be an issue here either, white background/blue lines.
{quote} Thanks. Well have it compiled with the mqh file and downloaded the swedll file and installed it. Indi shows up in window but no indi display. Anyone have any suggestions? I am getting a number for the acceleration calc showing but no visual lines. Not sure if the calculated number is right either, it changed for earth/moon and others so assuming it's right. Colors should not be an issue here either, white background/blue lines.
Ignored
You may need to enable dll in the input window of the indicator?
Otherwise try changing the timeframe (to a larger timeframe) - it is possible that the calculated acceleration could be too small for - for example the TF=1 min. (If this is the issue I guess I could quickly fix this in the evening - I now calculate the acceleration as simply the difference of velocities, would be better to divide it with the timeframe, then it is TF-independent).
{quote} Hi Sixer, The idea behind the indicators that I'm sharing is to try to determine a plausible physical mechanism for observed effects, like the effect of lunar cycle in stocks. I approach this from the point of view of a skeptic: For example to me there is absolutely no reason why Saturn-trine-Jupiter would have any effect on the stock market. However, if there is an observed effect, an...
Ignored
There is an eSignal HURST Cycle Indicator that has the full source disclosed - it's adjustment and how to position it correctly on the chart will be different from the MT4 version - eSignal users will be familiar with the 'No Scale' option on their charts, plus adjusting the 'Wavelength' parameter in the indicator will easily be able to position the Hurst Cycle appropriately - other than those differences, the key algorithm calculations are fully disclosed - although they are written in EFS - eSignal's javascript-based scripting language. Screenshot below:
This is no cycle indicator. It is called extrapolator: https://www.mql5.com/en/code/8608 You must test different settings to find the "optimum" for the time frame you are using. Sixer Edit: It is continously recalculating !!
Ignored
Thanks Sixer, I will study and backtest the Indie.
{quote} You mean something like this? If so, I can look into the conversion to MT4. k
Ignored
Exactly - BTW that EFS study is also posted on the eSignal Forums - It has the ability to display the multiple Hurst Cycle Waveforms (W1 - W4 and CYCLE) simultaneously - the MT4 Indicator that bingo bongoo has been using and was also mentioned in kprsa's post, appears to only be able to plot the CYCLE Waveform as defined by Hurst - while the eSignal Indicator can selectively plot the Hurst Waveforms (W1 - W4 and the CYCLE waveform) individually, or display all of 5 of the Waveforms simultaneously. See Screen shot below that sows all 5 Hurst Waveforms displayed simultaneously on the eSignal chart:
{quote} Exactly - BTW that EFS study is also posted on the eSignal Forums - It has the ability to display the multiple Hurst Cycle Waveforms (W1 - W4 and CYCLE) simultaneously - the MT4 Indicator that bingo bongoo has been using and was also mentioned in kprsa's post, appears to only be able to plot the CYCLE Waveform as defined by Hurst - while the eSignal Indicator can selectively plot the Hurst Waveforms (W1 - W4 and the CYCLE waveform) individually, or display all of 5 of the Waveforms simultaneously. See Screen shot below that sows all 5 Hurst...
is not in line with Hurst's work. There the amplitude of the cycle is supposed to be proportional to the wavelength. The cycles with this proportionality principle would rather look like this (assuming for a moment that wa2 is at its theoretical value of 4):
Joined Feb 2007
|
Status: Trader
|3,257 Posts|
Online Now
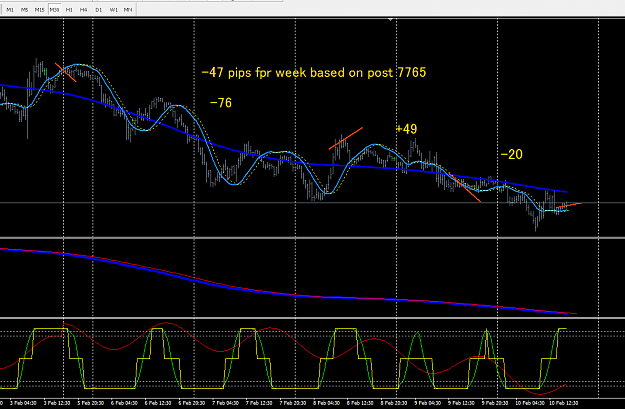
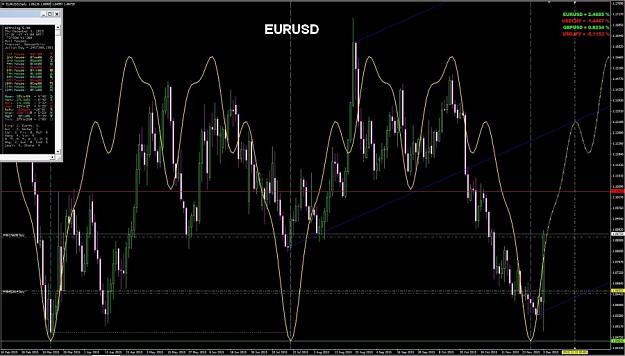
End of the Week recap... The Earth Venus 14 harmonic helio model from post 7765 ended up having a net loss of 47 pips for the week. (Chart 1)
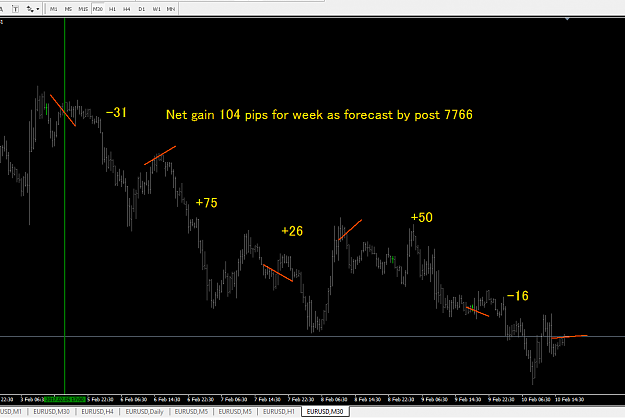
The next projection line was an experimental Neural Net projection line based on the top 3 cycles from the spectrum module... "As an experiment, here is a neural net projection based on 1,50,50 smoothed oscillator and the top 3 extracted cycles from the spectrum module and run through 50k training cycles... will compare models at the end of the week."
The same "procedure" as at the end of last/beginning of this year ?? Sixer {image}
Ignored
Sixer yes . I like this idea. It binds well with the F.Moon late Fri. and the Sat. and Sunday signatures [ Sun trine Jup. Mars 30* Nept. - Mars Sext. Nept. HELIO ]