Most if not all indicators are derived from price and therefore respond after the fact which means price moves first and then the indicator makes its little calculations from these price movements and then it updates.
The indicator visual is therefore lagging behind price which means if you follow an entry signal from a lagging indicator then you are too late to the party and can easily miss out on a nice move which you might have been able to grab hold of if you knew how to trade using PA and ignored the lagging indicators entirely.
Such examples of lagging indicators are as follows:
MACD
RSI
STOCHASTIC
CCI
BOLLINGER BANDS just to name a few.
.......... and the list is endless.
A pivot point indicator is not lagging because it derives its data from a previous period of time and then does the calculation to determine the various levels and then projects them onto the current period whatever that may happen to be (could be H4, D1, W1 or Monthly).
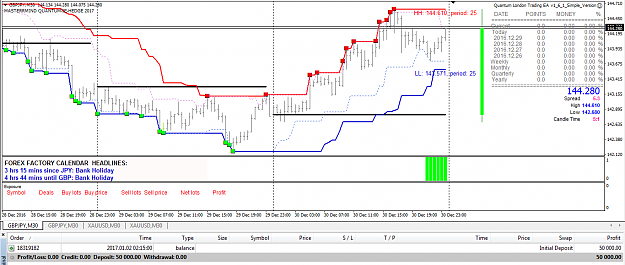
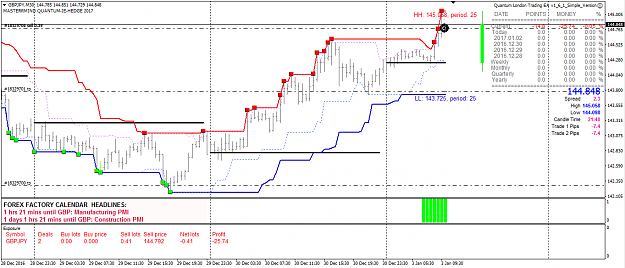
The Quantum indicator is also not lagging because as soon as price breaks through either higher or lower based on user set period (eg Quantum set = 40 on an M5 chart) a signal box appears and it also never repaints and will always print on the same candle that it first appears. An important point to make here is that the candle does not need to complete before a Quantum signal box is printed.
This is why I prefer not to use lagging indicators.
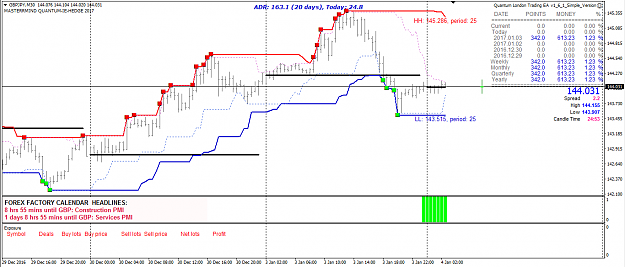
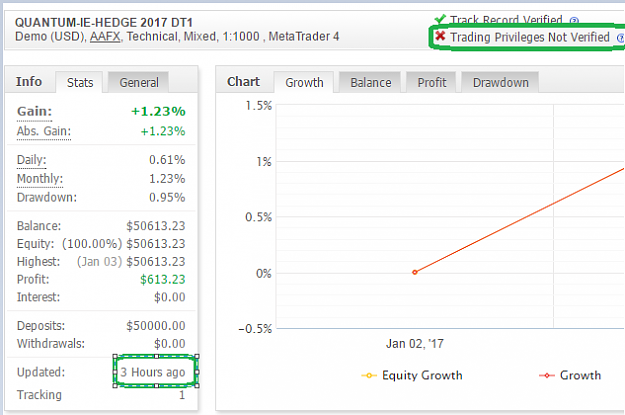
I do like informative indicators though for timely and accurate trading data such as ATR, ADR, drawdown%, current profit etc etc etc.
Masterrmind............
Master your Mind then Master your Trades