Disliked{quote} I have no answer for the 2 first Qs, but I'd like to see H4 and D1 charts.Ignored
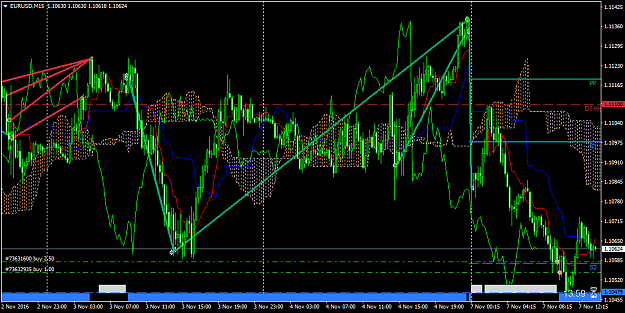
About the requested trend lines. I am publishing information about my theory that I named ¨How Market Works: Correlation Patterns - Volume and Time¨. Volume and force is relative to volume. A certain amount of numbers of a chart measured in v-olume which means practically a certain volume of price data that is or was shown in a chart. The certain volume are going to influence during a certain amount of time in the volume of the future.
Price data. Price based on the past and/or present (Historic and/or actual data). The greater majority of all indicators types are based on past data. How to use indicators based in actual data and only actual data?. Practically, it is not probably to have benefits.
Force is relative to volume. Once measured the volume, you can predict the force of a chart that will influence a certain future time. Basically The force is determined by the same volume, because there will come a time when the volume does not have sufficient force to move up or down in a particular area and I think in some cases in multiple areas where there is a large or/and amount of volume.
This theory has about 100 of accuracy but is difficult to use with actual prices.
I will post the photo soon.