Hi Batus! 
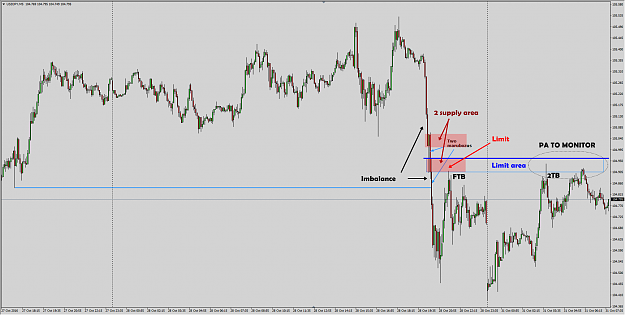
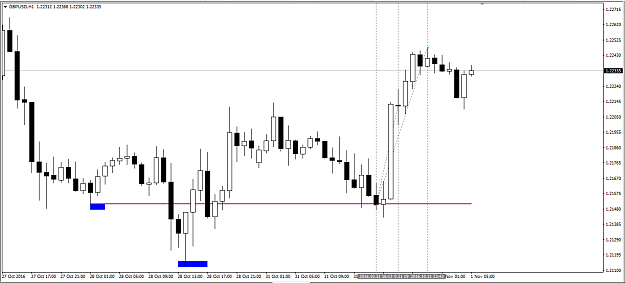
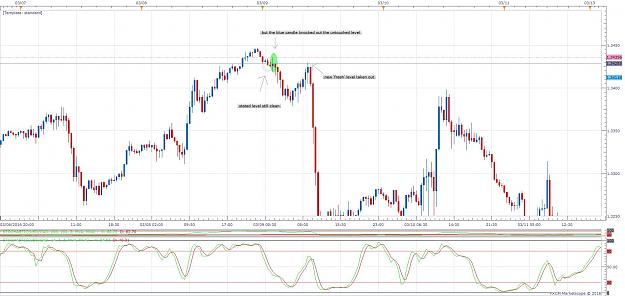
Could you tell me how did you come out with the supply zone in your M5 USDJPY chart? All I can come up with is the old QM level that got engulfed (thick blue line), and the supply zone is the decision to that movement.
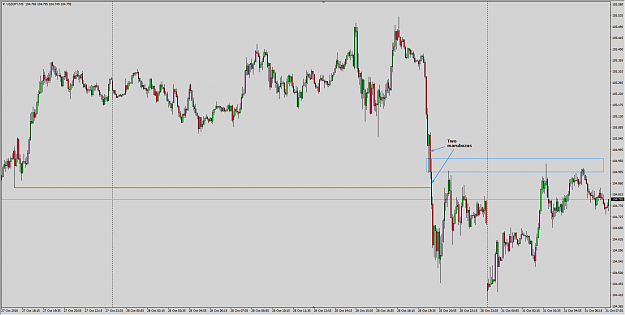
Could you tell me how did you come out with the supply zone in your M5 USDJPY chart? All I can come up with is the old QM level that got engulfed (thick blue line), and the supply zone is the decision to that movement.
Attached Image (click to enlarge)
Simplicity is the key to brilliance
1