• Home
  • Forums
  • Trades
  • News
  • Calendar
  • Market
  • Brokers
  • Login
  • Join
  • User/Email: Password:
  • 12:49pm
Menu
  • Forums
  • Trades
  • News
  • Calendar
  • Market
  • Brokers
  • Login
  • Join
  • 12:49pm
Sister Sites
  • Metals Mine
  • Energy EXCH
  • Crypto Craft

Options

Bookmark Thread

First Page First Unread Last Page Last Post

Print Thread

Similar Threads

Price pattern scanner where I choose the pattern 4 replies

Price Pattern Notifications/Trend Alert Price Action Scanner 7 replies

Price action and pattern trading 137 replies

Price Action Pattern Recognition Live Trading 33 replies

Price action pattern, and random thoughts 6 replies

  • Trading Systems
  • /
  • Reply to Thread
  • Subscribe
  • 2
Attachments: Price Action and Chart Pattern Trading
Exit Attachments

Price Action and Chart Pattern Trading

  • Post #1
  • Quote
  • First Post: Nov 23, 2014 5:09pm Nov 23, 2014 5:09pm
  •  tradingeasy
  • | Joined Oct 2014 | Status: Member | 32 Posts
Hello, I want to introduce a style of trading that is not real common in forex but has worked VERY well for me. Before I get started however I do want to say if you wish to argue with me on here and introduce lots of indicators and just make stupid comments you will be ignored very quickly. I am not here to fight with people I am here to share what WORKS WELL for me.

I do have indicators on my screen but about the only one I really care about is the moving average and the pivots. The moving average you see on the screen is actually the coral from the THV forum or you may use the 89 EMA which is very similar.

First of all, I do not trade EVERYDAY AND EVERY SESSION. Market must be trending on whatever pair and I do trade many pairs. My goal is just 2 trades a day and I risk 1%-2% a trade. After a loser I will increase my next trade by half of a percent. This keeps my money management sound and helps me recoup a loss quickly when I make one. It is very rare to ever have more than 2 or 3 losers in a row. Some weeks I have no losses. My goals are 10% a month and this is easily doable with little stress and without sitting at my computer for hours at a time. You could easily make 20% a month by simply increasing your risk per trade. I enjoy the little stress and less risk, and yes I do have a much much larger account which I trade these set ups on and no I will not post it on FF. If you cannot see the value behind what I do you really should not be in the markets.

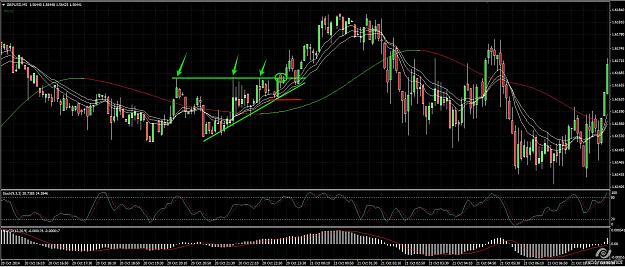
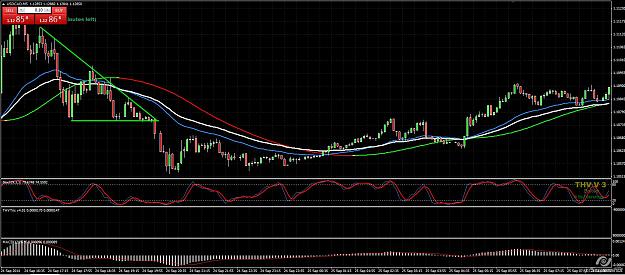
Like I said, I am looking for a type of breakout trade here. I generally do head and shoulders or ascending and descending triangles with the trend. The 5 minute time frame is BY FAR the best one to trade. Upon entering a breakout trade on the 5 minute however I must preface by saying I check the 15 and 1 hour to make sure my moving average is not there to stop the trade! This moving average is very powerful so if you happen to see a long breakout set up on the 5 minute yet the 15 minute moving average is a few pips away and price is below it then you would NOT want to take the trade!! So very important!!!! Anyways, lets get on with some examples here.
  • Post #2
  • Quote
  • Nov 23, 2014 5:31pm Nov 23, 2014 5:31pm
  •  tradingeasy
  • | Joined Oct 2014 | Status: Member | 32 Posts
Here is the first example I want to share. I will try to share more examples in the future as long as they are GREAT examples. There are times I take some that are very obvious to me but may not be so to the untrained eye thats why im not sharing any from the last few days but rather this one. Take note how price kept hitting the same level over and over again here. Also note how price started to get super tight. This is forming an ascending triangle pattern and will likely cause a pretty strong upward thrust. It is generally best to get into the trade once all highs are taken out and then place your stop at the last low as demonstrated here with the red stop loss line. The idea is EQUAL HIGHS and higher lows; this is causing great pressure on the pair and in most cases will eventually break out to the upside. The descending triangle works the same way. Again, it is all about price. You just want to make sure there is no major moving average or recent past price resistance in this area to stop such a breakout from occuring!
Attached Image (click to enlarge)
Click to Enlarge

Name: triangle1.jpg
Size: 269 KB
 
 
  • Post #3
  • Quote
  • Nov 23, 2014 5:32pm Nov 23, 2014 5:32pm
  •  tradingeasy
  • | Joined Oct 2014 | Status: Member | 32 Posts
i almost always take half of my trade off after the equivalent to my stop loss is made in profit. In this case that would be about 7 pips. I do let the rest run into recent resistance or if price is struggling to move as this may indicate a retrace or reversal.
 
 
  • Post #4
  • Quote
  • Nov 23, 2014 8:34pm Nov 23, 2014 8:34pm
  •  dinhienhy
  • | Joined Sep 2013 | Status: Member | 59 Posts
Subscribed!
 
 
  • Post #5
  • Quote
  • Nov 23, 2014 11:45pm Nov 23, 2014 11:45pm
  •  tradingeasy
  • | Joined Oct 2014 | Status: Member | 32 Posts
A bit older trade here but I want to show it because its a great set up. Notice the triangle pattern in the green lines. Once the low is broken from this ascending triangle its time to enter short with a stop just above the last swing high. In this case that would be about 13 pips. The trade did end up going about 20 pips before reversing. Heres the reason why this trade is so good. Notice the first move down to the 1.1075 level and then the nice bounce up. Then we have the second test of the same level before a much smaller bounce is made. Then just before the breakdown we have a final test of that area. Heres what I like about his last time however: You had about 5 candles of sideways action at support. What is this telling us? It tells us there is a war going on at this level and at the same time its telling us the buyers that were coming in to save the market just are not able to take prices higher. When I see this I am most certainly ready to pile in ESPECIALLY IF PRICE MOVES SIDEWAYS INTO MY MOVING AVERAGES. In this case I dont have the 10-15-20 emas on my chart but on most every other chart you will see them. They arent a bad idea to have them but its really not that necessary. I will also note if you see a triple top formation and on the third test of the triple top (or bottom) if price is moving sideways and just does not come down the market is telling you theres no sellers present and price is most likely going to roar higher. Just something I want to throw in there because you will see that in future charts and its something i have never seen anyone taught on!!! (Just what i have noticed from staring at charts all day every day for the last 10 years) One final thing I want to note here also is I dont want this to just be a system where people are trying to find these patterns...i want people to try to "feel" what the market is doing...after years of experience this is something i have developed and its far more powerful than any indicator.
Attached Image (click to enlarge)
Click to Enlarge

Name: triangle3.jpg
Size: 266 KB
 
 
  • Post #6
  • Quote
  • Last Post: Nov 27, 2014 2:13pm Nov 27, 2014 2:13pm
  •  -er-
  • | Joined Aug 2011 | Status: Member | 523 Posts
how do you manage your time during trading? , do you have fix rules to determent if the market trending or in the rage?

do you put fending and go away from the screen or you siting for hours over hours until the trade done ?

I find the 5m very hard to trade , on the 5 m charts you need to invest to much time I front of the screen.

for me the 5 m is worse choise how do you manage it ? any advise ?
Iam just A pips on the rode :nerd:
 
 
  • Trading Systems
  • /
  • Price Action and Chart Pattern Trading
  • Reply to Thread
0 traders viewing now
Top of Page
  • Facebook
  • Twitter
About FF
  • Mission
  • Products
  • User Guide
  • Media Kit
  • Blog
  • Contact
FF Products
  • Forums
  • Trades
  • Calendar
  • News
  • Market
  • Brokers
  • Trade Explorer
FF Website
  • Homepage
  • Search
  • Members
  • Report a Bug
Follow FF
  • Facebook
  • Twitter

FF Sister Sites:

  • Metals Mine
  • Energy EXCH
  • Crypto Craft

Forex Factory® is a brand of Fair Economy, Inc.

Terms of Service / ©2022