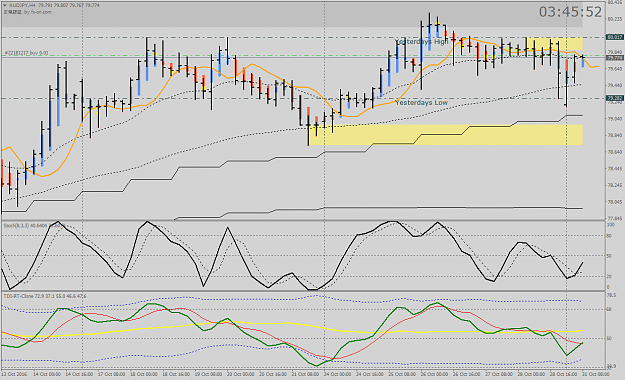
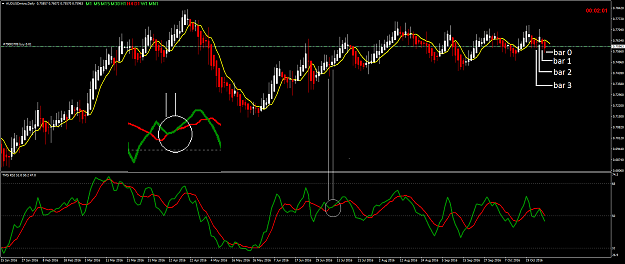
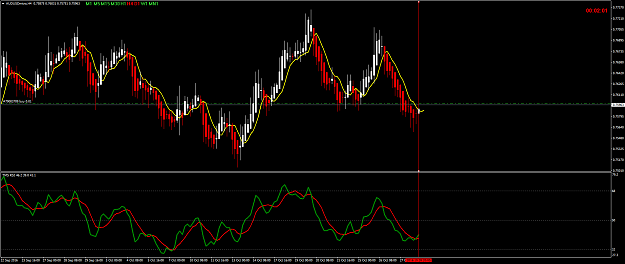
Disliked{quote} As i learn from past chart, i found that a TDI cross = HA color change (this mean setup candle #1). so can i trade on candle #2 open (using japanese candle)? Is that safe?Ignored
- #72,823
- Edited 3:44pm Oct 30, 2016 1:14pm | Edited 3:44pm
- Joined Nov 2015 | Status: Member's sanity currently on AWOL | 8,930 Posts
- #72,824
- Oct 30, 2016 1:24pm Oct 30, 2016 1:24pm
- Joined Jan 2015 | Status: Never underestimate value of an pip | 4,677 Posts
- #72,826
- Oct 30, 2016 1:35pm Oct 30, 2016 1:35pm
- Joined Jan 2015 | Status: Never underestimate value of an pip | 4,677 Posts
- #72,827
- Edited 1:55pm Oct 30, 2016 1:37pm | Edited 1:55pm
- Joined Nov 2015 | Status: Member's sanity currently on AWOL | 8,930 Posts
- #72,828
- Oct 30, 2016 1:50pm Oct 30, 2016 1:50pm
- Joined Aug 2012 | Status: Trader | 18,661 Posts
the cautious seldom err....C
- #72,829
- Edited 3:40pm Oct 30, 2016 2:47pm | Edited 3:40pm
- Joined Nov 2015 | Status: Member's sanity currently on AWOL | 8,930 Posts
- #72,834
- Oct 30, 2016 6:50pm Oct 30, 2016 6:50pm
- Joined Nov 2008 | Status: Trader | 50,211 Posts | Online Now
Honesty is a very expensive gift. You wont find it in cheap people.WBuffett
- #72,835
- Oct 30, 2016 7:10pm Oct 30, 2016 7:10pm
- Joined Nov 2008 | Status: Trader | 50,211 Posts | Online Now
Honesty is a very expensive gift. You wont find it in cheap people.WBuffett
- #72,836
- Oct 30, 2016 7:42pm Oct 30, 2016 7:42pm
- Joined Nov 2008 | Status: Trader | 50,211 Posts | Online Now
Honesty is a very expensive gift. You wont find it in cheap people.WBuffett
- #72,837
- Oct 30, 2016 8:02pm Oct 30, 2016 8:02pm
- Joined Nov 2008 | Status: Trader | 50,211 Posts | Online Now
Honesty is a very expensive gift. You wont find it in cheap people.WBuffett
- #72,838
- Edited Oct 31, 2016 5:14pm Oct 30, 2016 8:06pm | Edited Oct 31, 2016 5:14pm
- Joined Nov 2008 | Status: Trader | 50,211 Posts | Online Now
Honesty is a very expensive gift. You wont find it in cheap people.WBuffett