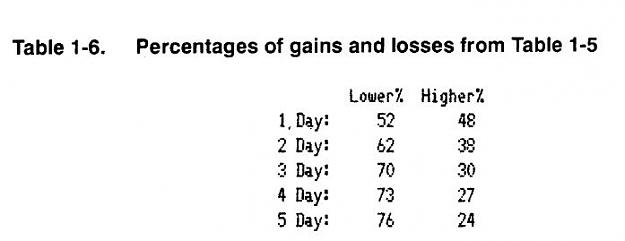
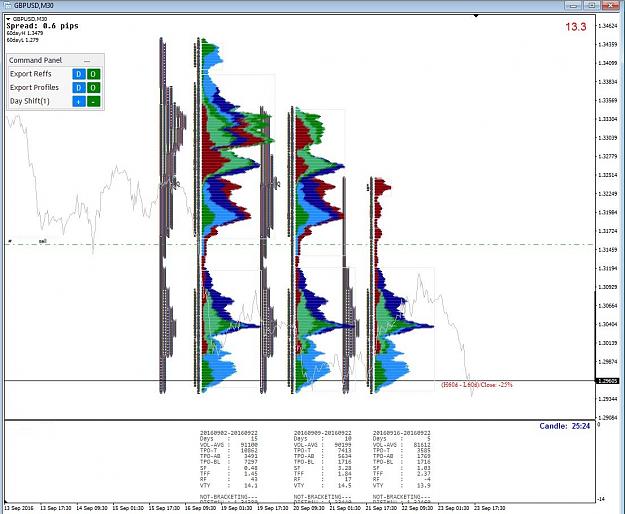
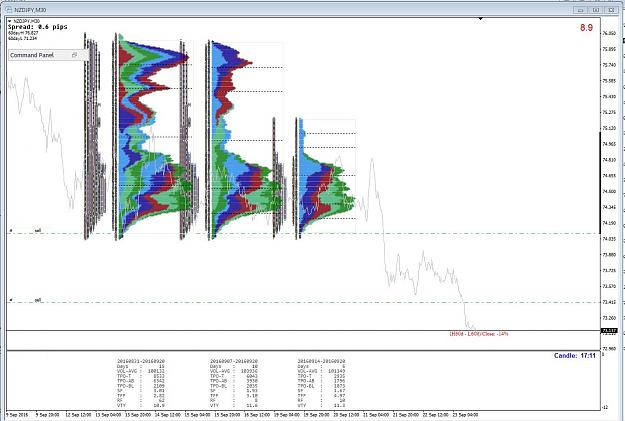
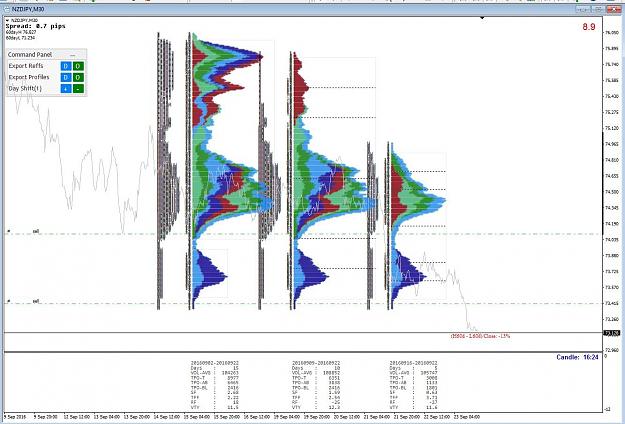
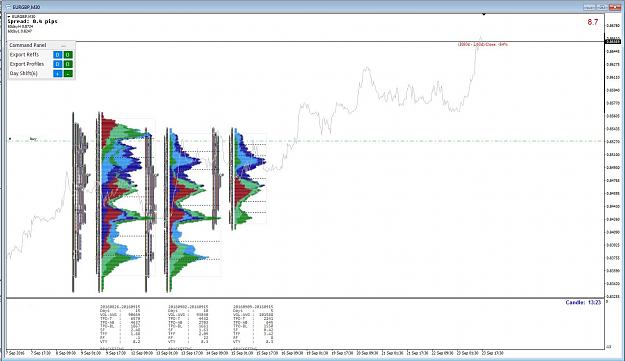
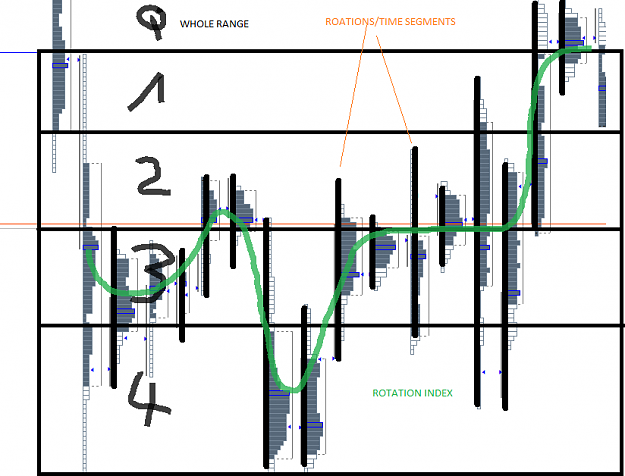
This chapter is about data and the utility of data for futures research. Before we look at the actual data, we must identify what we need; how the data will be used and how well conditioned the data are for our purpose. Data that are not right for a job will lead to costly errors. Our data should help us determine the market's structure: day structure from the Market Profile distribution, longer-term structure from the Overlay Demand Curve distribution.
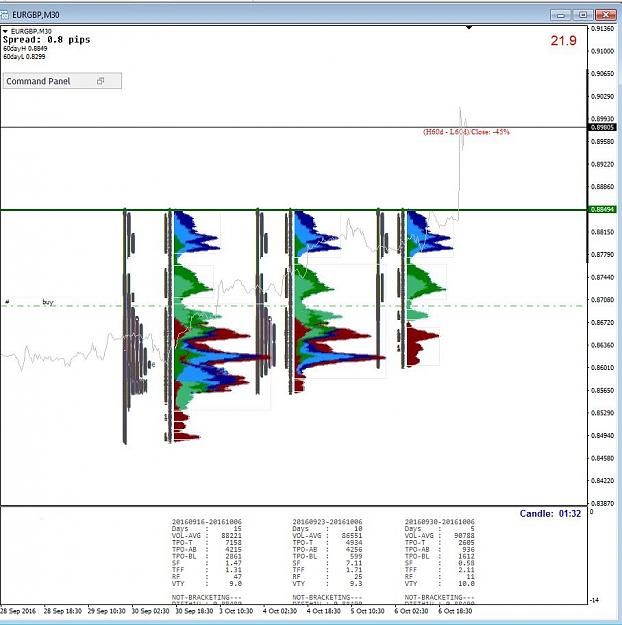
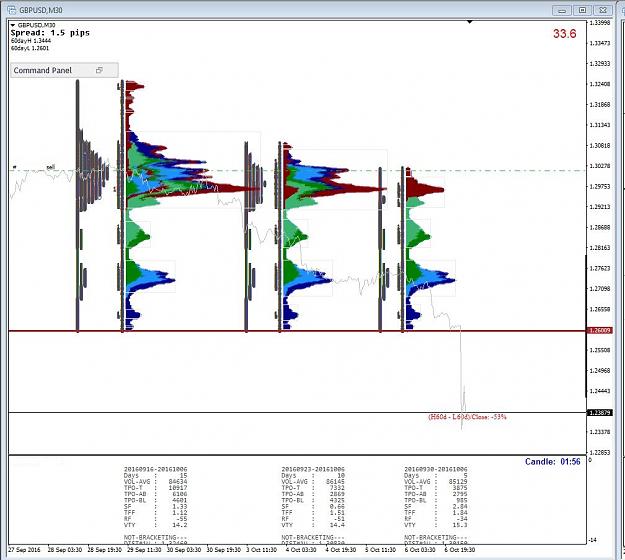
Structure is a visual. It shows whether the market is well behaved, with a smooth distribution, or jagged and irregular. Half-hourly data have proven to be ideal for helping to determine market structure.The market's condition is also found from the distribution of the profile. Condition is what the market is doing, the state it is in: bracketing, trending, or too volatile to tell. Markets forming a single bell-shaped distribution are usually bracketing, i.e., in a trading range. Trending markets have their own distinctive form, combining several separate distributions.
Reference Points
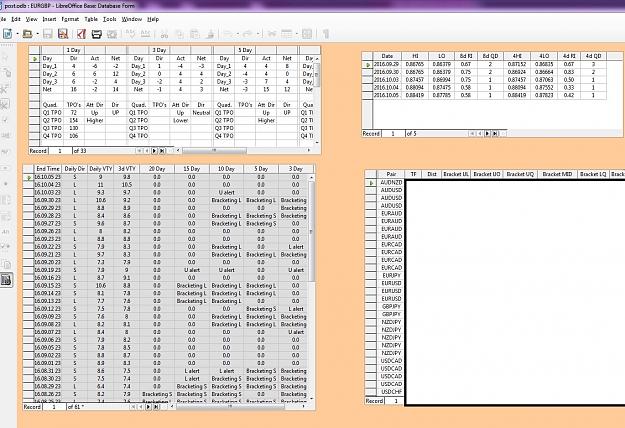
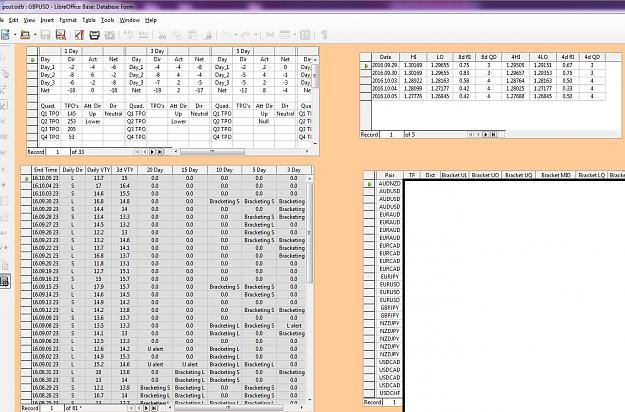
A market's structure and condition determine its amenability to analysis. A great deal of market information and understanding can be obtained from bracketing markets. Value and the two bracket limits are three of the most important reference points. Others, of sometimes crucial importance, come from analysis of commercial behavior on the Liquidity Data Bank reports, from daily profile analysis, and from the measurement of internal trends in a bracket; there are several beyond even these. The better the reference points are defined, the better the market understanding and the better our risk control.
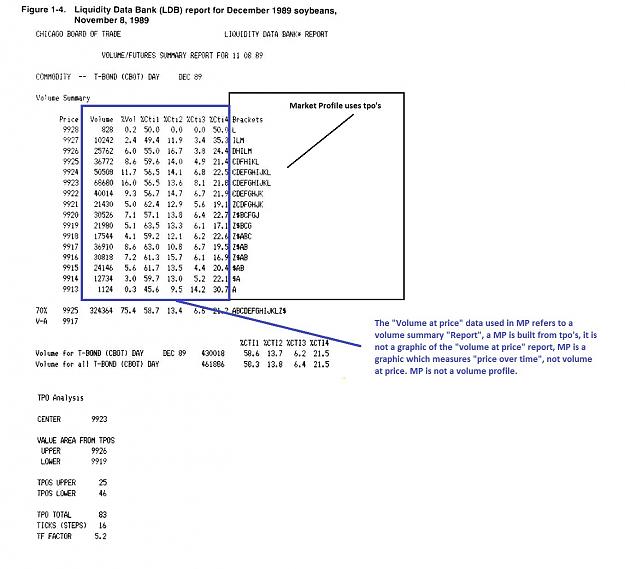
There are two principal types of value: "day value" Pertains only to the current trading day; value without the "day" modifier refers to longer- term, more general value. Day value is the value area in the Liquidity Data Bank, where value area actually has meaning only in balanced markets. Longer-term value is a similarly defined price (range) in a bracketing market and is harder to pin down in moving markets where value may lead or lag price. In either case, value is always a (limited) range of prices at any given time regardless of a market's condition. when we set out to calculate value we quickly come to the realization that value is intimately tied to sampling rates.
Value
Value is the key factor in responsive trade selection for the day trader. In a stable, bracketing market, market-offered opportunity occurs when price moves away from value. Oddly enough, value is (implicitly) used by the position trader as well. The position trader, looking for breakouts, is betting that value is changing and that price will not return to the bracket. Position traders who are trading an ongoing trend are betting that price has not reached value and, hence, that the trend will continue. Value is (1) A price (range) recognized as a fair estimate of monetary worth, arrived at via price reinforcement (sampling) over time. (2) The most frequently occurring price (region) within a period of price stability.
For example, tomatoes have cost $1.70/lb. the last six weeks. Price over time implies value, so tomatoes are worth $1.70/lb. Today at the market, tomatoes are $0.90 Per Pound. A bargain? Maybe. Price has certainly dropped, but value may have also dropped. we cannot tell from this one sample. Our experience, our sampling time, is too short.
The average time frame sets the limits on the required sampling rate to detect change. A critical question is the time rate of change of the phenomenon being sampled. That is, how fast it is changing. In order to measure the change, we must sample at a rate high enough to define the phenomenon. we must have a number of samples while the change is occurring. A market that moves substantially within a day or two will have to be sampled a number of times per day to define the change. A too frequent sampling rate (say, every minute) loads us down with meaningless data. If the sample time is too long (say just once per day) we are not able to define the change.
If we checked the tomato prices at the supermarket 20 times a day, we would gain no more information than by checking once a day. Our high sampling rate yields no additional information. Nor if we sampled tomato prices every three months would we gain much knowledge about the value of tomatoes, since we know from years of experience that the tomato value time frame is one to a few weeks.
Today's futures market time frame is now often in the range of 5 to 20 days. That is, prices change substantially within that length of time, on the average. Several years back the market's time frame was much longer, from one to several months. The change in average time frame has profound implications on technical market analysis.
Sampling Rates
The rise of technical analysis in the early 1970s was fueled by the newly emerging access to (mainframe) computers and the availability of daily summary data from the exchanges, published in newspapers. Eater, the invention of the personal computer and the rise of data services put analytic capabilities in the hands of many traders. The sampling rate, thus, was daily, and adequate for the times.
Sampling the futures market of today once per day, however, is usually inadequate to detect significant changes soon enough to do anything about them. A market with a time frame as short as five days cannot be defined by daily sampling; the sampling rate must be high enough to get inside" the market; five samples could not identify value. Many traders still use daily data because it is easy and cheap to acquire, and there is a great deal of software for processing this type of data.
At the other extreme, tick by tick sampling picks up mostly noise. The data are there, but each sample has a very small information content. The day trader who watches ticks is often misled by the random movement of the market. The increased sensitivity of more frequent samples is masked by the noise. . . the random fluctuations.
what is a reasonable sampling rate for futures? Daily is too seldom. Each tick is too frequent. How fast do the markets change? The market's rate of change determines how short or how long our measuring rate should be, but an actual, average rate of change is hard to measure.
Since we have the limits defined, a reasonable approach is to do "order of magnitude" estimates to zero in on the proper sampling rate. An order of magnitude is a factor of 10. If the whole day is too long, an order of magnitude less is one-tenth of a trading day, or about 30 minutes. If the tick-to-tick time is too short, we find an order of magnitude longer to be in the range of a few minutes. So, our best guess for a proper sampling rate is, without actual case studies, a few to 30 minutes.
Finding the ideal sampling rate that will gain the most knowledge about a market is still an open research problem. we know that we must define just what it is that we are looking for (not just value) and how to measure it. we want to be able to see significant features as they develop, rather than, as on daily bar charts, after they are over. we need a sampling rate that shows adequate detail without being swamped by too much data. And we can be sure that the best sampling rate for a market that is undergoing rapid change is not the best for one that is moving slowly. So, for most real-world situations, we seek the sampling rate that works well for a broad range of market conditions. That need pushes us in the direction of somewhat less rather than more sensitivity, indicating a sampling rate at the upper end of the time scale, around 15 to 30 minutes.
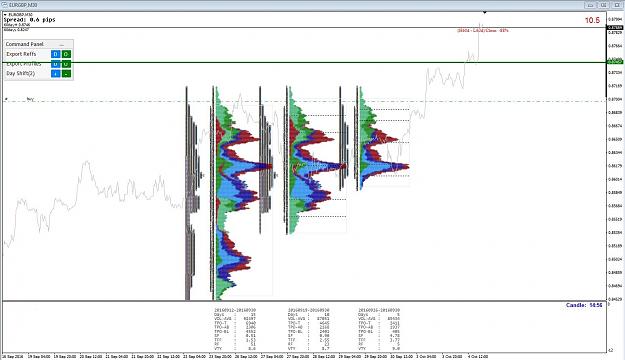
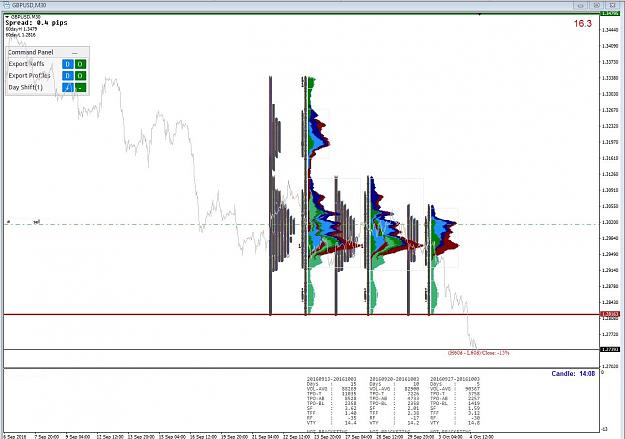
Fortunately, there is an extensive 30-minute database going back five or six years. It is incorporated in the Market Profile of the CISCO database and is available to CiSCO customers. This database is used to develop the Overlay Demand Curve as well as to identify value and the trading reference points associated with bracketing and trending markets.
VBPT p. 1-4
Structure is a visual. It shows whether the market is well behaved, with a smooth distribution, or jagged and irregular. Half-hourly data have proven to be ideal for helping to determine market structure.The market's condition is also found from the distribution of the profile. Condition is what the market is doing, the state it is in: bracketing, trending, or too volatile to tell. Markets forming a single bell-shaped distribution are usually bracketing, i.e., in a trading range. Trending markets have their own distinctive form, combining several separate distributions.
Reference Points
A market's structure and condition determine its amenability to analysis. A great deal of market information and understanding can be obtained from bracketing markets. Value and the two bracket limits are three of the most important reference points. Others, of sometimes crucial importance, come from analysis of commercial behavior on the Liquidity Data Bank reports, from daily profile analysis, and from the measurement of internal trends in a bracket; there are several beyond even these. The better the reference points are defined, the better the market understanding and the better our risk control.
There are two principal types of value: "day value" Pertains only to the current trading day; value without the "day" modifier refers to longer- term, more general value. Day value is the value area in the Liquidity Data Bank, where value area actually has meaning only in balanced markets. Longer-term value is a similarly defined price (range) in a bracketing market and is harder to pin down in moving markets where value may lead or lag price. In either case, value is always a (limited) range of prices at any given time regardless of a market's condition. when we set out to calculate value we quickly come to the realization that value is intimately tied to sampling rates.
Value
Value is the key factor in responsive trade selection for the day trader. In a stable, bracketing market, market-offered opportunity occurs when price moves away from value. Oddly enough, value is (implicitly) used by the position trader as well. The position trader, looking for breakouts, is betting that value is changing and that price will not return to the bracket. Position traders who are trading an ongoing trend are betting that price has not reached value and, hence, that the trend will continue. Value is (1) A price (range) recognized as a fair estimate of monetary worth, arrived at via price reinforcement (sampling) over time. (2) The most frequently occurring price (region) within a period of price stability.
For example, tomatoes have cost $1.70/lb. the last six weeks. Price over time implies value, so tomatoes are worth $1.70/lb. Today at the market, tomatoes are $0.90 Per Pound. A bargain? Maybe. Price has certainly dropped, but value may have also dropped. we cannot tell from this one sample. Our experience, our sampling time, is too short.
The average time frame sets the limits on the required sampling rate to detect change. A critical question is the time rate of change of the phenomenon being sampled. That is, how fast it is changing. In order to measure the change, we must sample at a rate high enough to define the phenomenon. we must have a number of samples while the change is occurring. A market that moves substantially within a day or two will have to be sampled a number of times per day to define the change. A too frequent sampling rate (say, every minute) loads us down with meaningless data. If the sample time is too long (say just once per day) we are not able to define the change.
If we checked the tomato prices at the supermarket 20 times a day, we would gain no more information than by checking once a day. Our high sampling rate yields no additional information. Nor if we sampled tomato prices every three months would we gain much knowledge about the value of tomatoes, since we know from years of experience that the tomato value time frame is one to a few weeks.
Today's futures market time frame is now often in the range of 5 to 20 days. That is, prices change substantially within that length of time, on the average. Several years back the market's time frame was much longer, from one to several months. The change in average time frame has profound implications on technical market analysis.
Sampling Rates
The rise of technical analysis in the early 1970s was fueled by the newly emerging access to (mainframe) computers and the availability of daily summary data from the exchanges, published in newspapers. Eater, the invention of the personal computer and the rise of data services put analytic capabilities in the hands of many traders. The sampling rate, thus, was daily, and adequate for the times.
Sampling the futures market of today once per day, however, is usually inadequate to detect significant changes soon enough to do anything about them. A market with a time frame as short as five days cannot be defined by daily sampling; the sampling rate must be high enough to get inside" the market; five samples could not identify value. Many traders still use daily data because it is easy and cheap to acquire, and there is a great deal of software for processing this type of data.
At the other extreme, tick by tick sampling picks up mostly noise. The data are there, but each sample has a very small information content. The day trader who watches ticks is often misled by the random movement of the market. The increased sensitivity of more frequent samples is masked by the noise. . . the random fluctuations.
what is a reasonable sampling rate for futures? Daily is too seldom. Each tick is too frequent. How fast do the markets change? The market's rate of change determines how short or how long our measuring rate should be, but an actual, average rate of change is hard to measure.
Since we have the limits defined, a reasonable approach is to do "order of magnitude" estimates to zero in on the proper sampling rate. An order of magnitude is a factor of 10. If the whole day is too long, an order of magnitude less is one-tenth of a trading day, or about 30 minutes. If the tick-to-tick time is too short, we find an order of magnitude longer to be in the range of a few minutes. So, our best guess for a proper sampling rate is, without actual case studies, a few to 30 minutes.
Finding the ideal sampling rate that will gain the most knowledge about a market is still an open research problem. we know that we must define just what it is that we are looking for (not just value) and how to measure it. we want to be able to see significant features as they develop, rather than, as on daily bar charts, after they are over. we need a sampling rate that shows adequate detail without being swamped by too much data. And we can be sure that the best sampling rate for a market that is undergoing rapid change is not the best for one that is moving slowly. So, for most real-world situations, we seek the sampling rate that works well for a broad range of market conditions. That need pushes us in the direction of somewhat less rather than more sensitivity, indicating a sampling rate at the upper end of the time scale, around 15 to 30 minutes.
Fortunately, there is an extensive 30-minute database going back five or six years. It is incorporated in the Market Profile of the CISCO database and is available to CiSCO customers. This database is used to develop the Overlay Demand Curve as well as to identify value and the trading reference points associated with bracketing and trending markets.
VBPT p. 1-4
Markets are not efficient, rather they are effective - Jones