Salvatore, thanks a lot that you share your experience. Your results are really very good. I wish you good trading and I will continue reading your thread
Salvatore, thanks a lot that you share your experience. Your results are really very good. I wish you good trading and I will continue reading your thread
Hello Salvatore. Thanks. Good prediction thread. Such members as you make very good job and teach us to make our knowledge so wider. And i have looked at your results myfxbook. You are realy fantastic good trader. I wish you continue your profitable trading.
Ignored
Thank you very much. I am glad that you are interested in
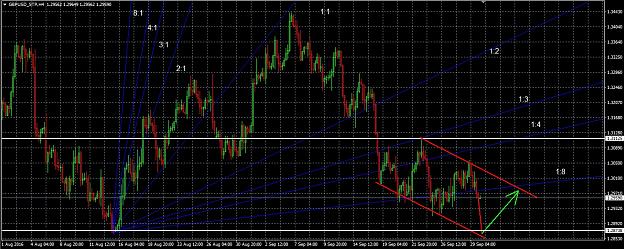
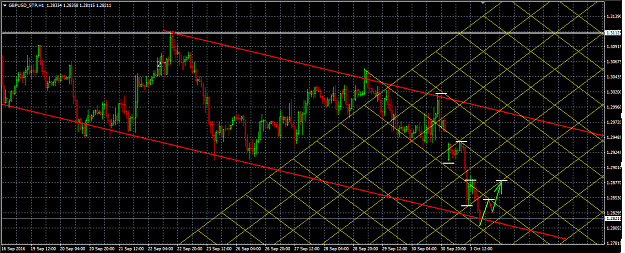
I think that now the turning point.
1. If the level is 1: 8, be broken in the near future, then it will be a further fall right up to the level of 1.28723, which was noted earlier.
2. This movement is due to the downward trend.
3. If the 1: 8 would be strong enough to stand the price and push it up, then we should expect a consolidation in the area of level 1: 8. Do not fall below 1.29607
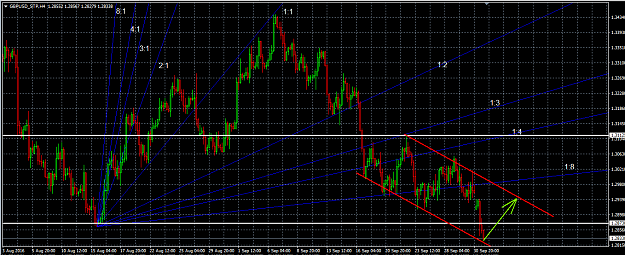
Today let's talk again about the GBP / USD, because now we can see a very interesting picture. Price has gone far down, of course, before that justified my prediction.
Before:
Attached Image (click to enlarge)
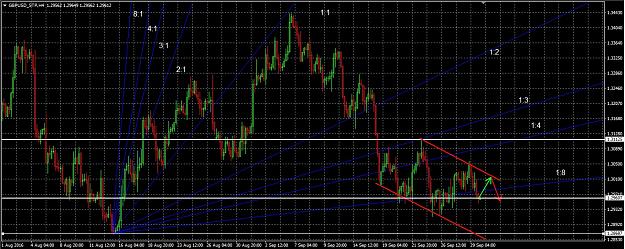
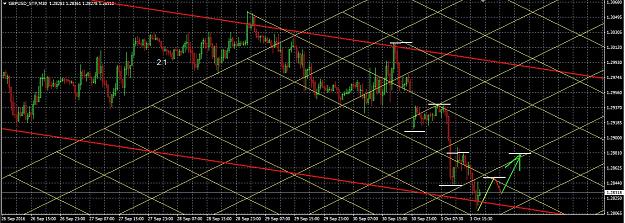
Now:
1. Trend channel indicates that you need to buy. This is also clear because the Falling Pulse has lost power and began a correction.
Attached Image (click to enlarge)
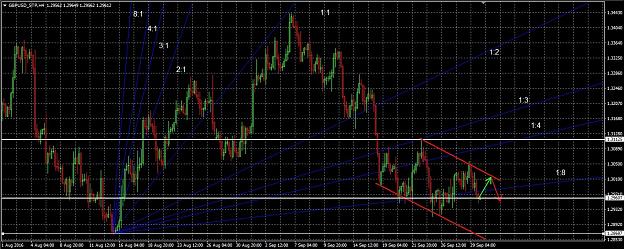
2. For a more detailed analysis, I needed grid Gunn.
The sides of the rhombus - a support \ resistance levels. We have to see the places where the price will probably touches the rectangle. Price is likely reaches the edge of the rectangle and begin a correction. They act just like Gann or Fibonacci grid. Only here the grid is represented as a grid of rhombuses.
Touching to the border of the rectangle and return. I put tp in the right place before the border of the rectangle. It worked. Now I think about whether or not to open a long-term buy.
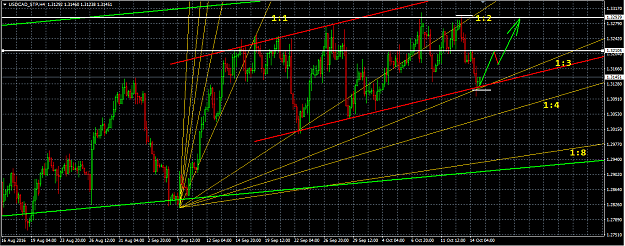
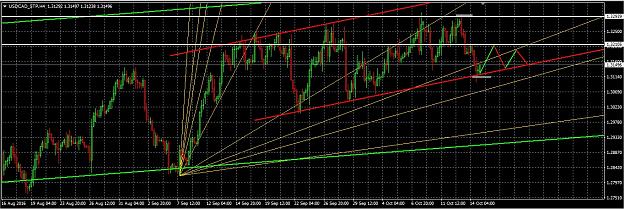
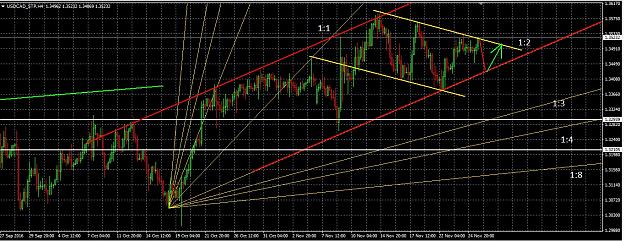
USD CAD. In my opinion, it will continue to move in a weak bullish trend.
1. Now is clearly seen that the price of the channel bottom.
2. You can see that the price has touched the level of 1: 3 Gann. This means that most likely will be correctional movement. Therefore, we opened a second version of the market movement. This is - testing channel bottom for break through and the correctional movement along the bottom of the channel.
3. If the price goes up, it will reach the middle of the channel. After that, it may be a reversal of motion, because the channel is weak.
4. Levels with white lines show the resistance and place of a possible correction.
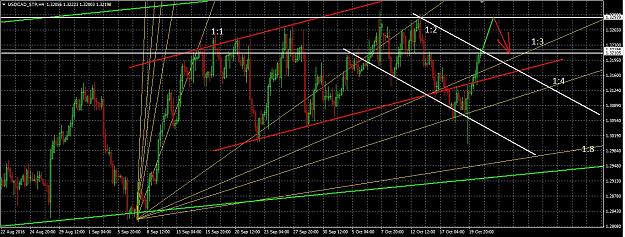
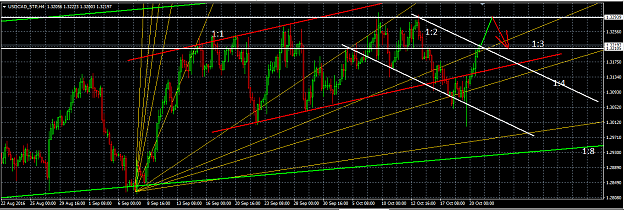
The price went down as much as up to 1: 4. There was a breakdown at this level, but soon the price returned to the level of 1: 3 and went right through him. Now the price of 1.32105 resistance area.
Before:
Attached Image (click to enlarge)
Now:
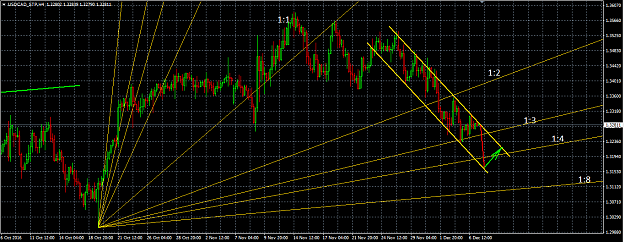
My prediction for the USD / CAD further movement - is:
1. The price can overcome the resistance level of 1.32105 and the growths to 1.32940. When it will return in a rising channel, but the achievement of ceiling of the channel - is unlikely.
2. We see that it is possible the formation of the downward trend. This can occur if the level of 1: 3 will not be broken. In this case, I predict a reduction to 1: 4 and thereafter increase again.
Hello Salvatore, I hope you keep on sharing your analysis and results with us. I am very new to FX, I made a FF account yesterday and have subscribed to you. Do you have any videos or something that can help me how to use Fann. I am very interested to try it out.
Anyways, keep on making profit
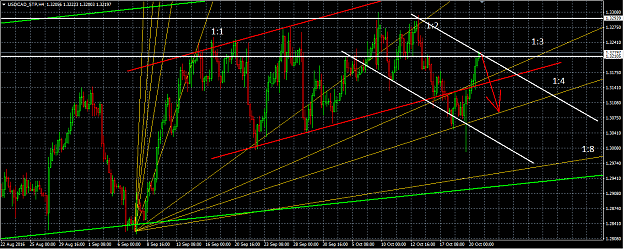
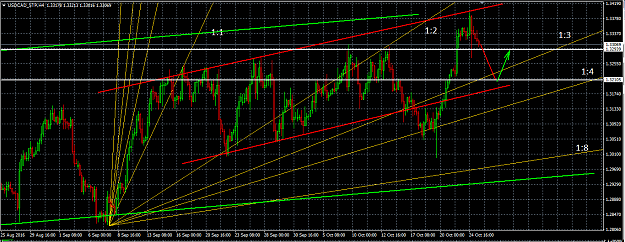
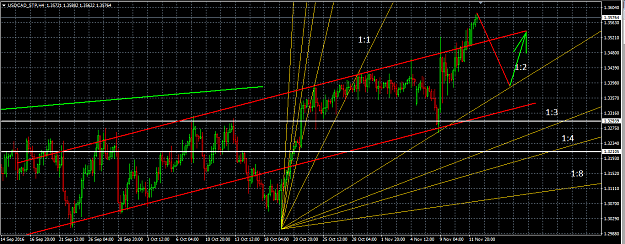
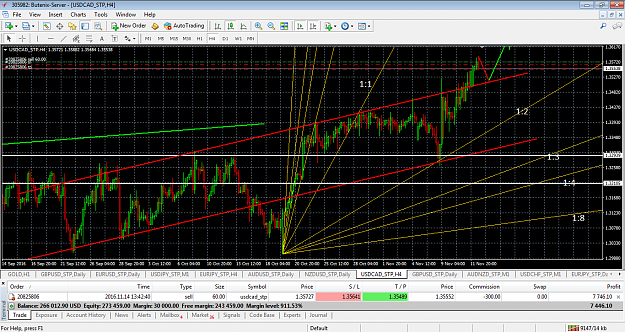
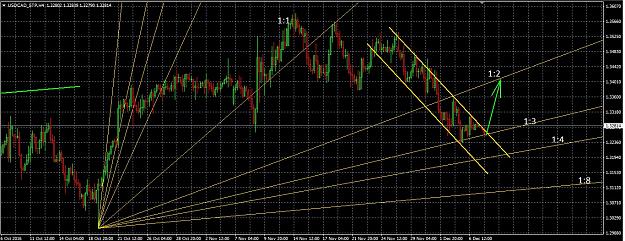
Ahead of the new trading week. Today, I will trade USD/CAD, my previous prediction was correct.
1. I see that the price has returned to the upstream channel as I expected. We can see how the price has stopped in front of the ceiling of the channel. At the same time, the level of 1.32940 was passed.
2. My prediction: If the level of 1:3 will be broken down, the price reaches 1.32105, and is likely to stop the decline. But if 1: 3 will not broken, then we will see growth close to 1:2, and after reaching the upper trend line, a return to 1:3.
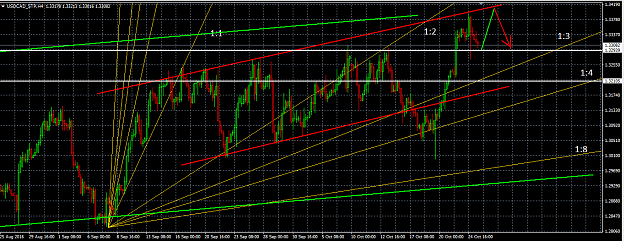
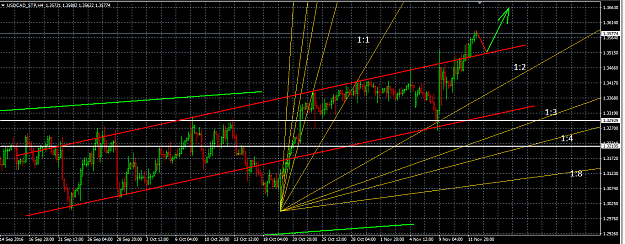
Before: {image} Now: Ahead of the new trading week. Today, I will trade USD/CAD, my previous prediction was correct. 1. I see that the price has returned to the upstream channel as I expected. We can see how the price has stopped in front of the ceiling of the channel. At the same time, the level of 1.32940 was passed. 2. My prediction: If the level of 1:3 will be broken down, the price reaches 1.32105, and is likely to stop the decline. But if 1: 3 will not broken, then we will see growth close to 1:2, and after reaching the upper trend line, a...
1. First of all, I want to say that the forecast for the movement in the upward trend was justified.
2. Thus, now we can see a small breakout of this trend upwards.
3. We can predict a return to trend, as its breakout - is likely a consequence of the news. And this will not be enough momentum to organize a long-term movement.
4. The last time the price was at the lower border of the trend, she jumped from the level of 1: 2.
5. Even if the price will go up, it will not continue not for a long time, this is my opinion. Although to be honest, the nearest strong resistance - is 1.46900. Use stop-loss, friends.
I would publish its forecast for USD/CAD
1. I have built two trends. First - up, the second - down (almost horizontal correlation). Now the price near the ceiling of the channel down to near the bottom of the rising channel.
2. It is also worth noting that the price is near the support level of 1:2.
3. The first version of the movement - a breakdown of the downward trend and further movement in the framework of a growing trend. But I do not see sufficient momentum to break through the average trend line.
4. The second option - if the price can not break through the 1.35200, it is likely that in the near future, it will go to test support for Gann 1:2
Today, I have built a forecast USD\CAD:
1. Trend is down. The price moves according to this trend, so the first scenario - the movement of the trend down to its bottom.
2. Thus, if downward movement, the price walks past level of 1: 3, which is now and will stop at 1: 4.
3. It should be noted that now the price is at a level of 1: 3. This correction level. Therefore, it may start a correction. Which will lead to an increase of up to 1: 2.
4. But I think that now the support is too weak to strong upward movement began. But you can not rule it out.