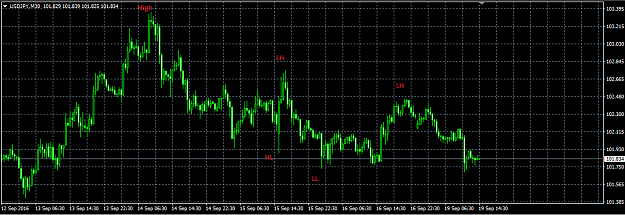
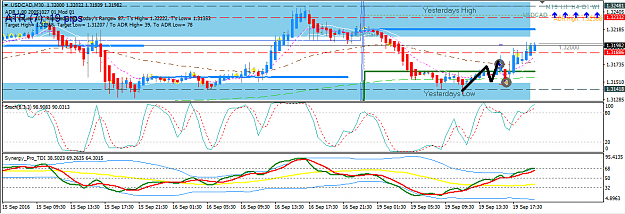
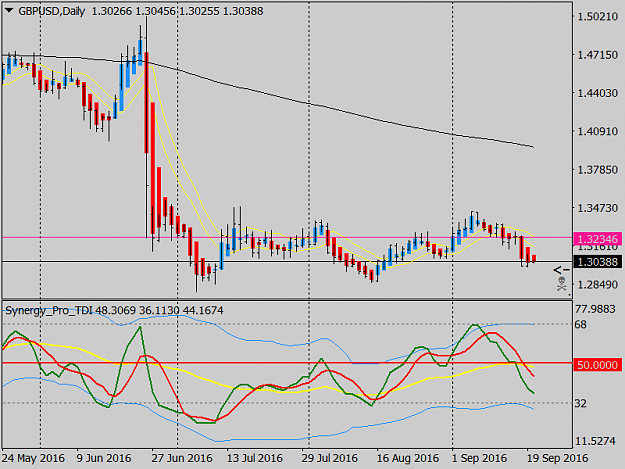
• Home
  • Forums
  • Trades
  • News
  • Calendar
  • Market
  • Brokers
  • Login
  • Join
  • User/Email: Password:
  • 10:03pm
Menu
  • Forums
  • Trades
  • News
  • Calendar
  • Market
  • Brokers
  • Login
  • Join
  • 10:03pm
Sister Sites
  • Metals Mine
  • Energy EXCH
  • Crypto Craft

Options

Bookmark Thread

First Page First Unread Last Page Last Post

Print Thread

Similar Threads

RiskyFX-M30 System 117 replies

Pulse M5, M15, M30,H1+ 9 replies

London Open Breakout-M30 57 replies

M30 Rainbow Madness 23 replies

Different between time frames M30 1H and 4H 2 replies

  • Trading Systems
  • /
  • Reply to Thread
  • Subscribe
  • 8,045
Attachments: TMS for M30 charts
Exit Attachments
Tags: TMS for M30 charts
Cancel

TMS for M30 charts

  • Last Post
  •  
  • 1 782783Page 784785786 922
  • 1 Page 784 922
  •  
  • Post #15,661
  • Quote
  • Sep 19, 2016 7:38am Sep 19, 2016 7:38am
  •  kain775
  • | Joined Feb 2016 | Status: Member | 817 Posts
Quoting likica
Disliked
{quote} if you only focus on pivots or MA or DOL and divergence and hidden divergence by themself , you will fail, unless you look at higher time frames like H4 D1 to buil positions. Your problem is you fail to read price actions around those levels to see if buyers or sellers were strong at that moment, that why you were confused whether to buy or to sell. Can you see that price were stepping down? both big picture (look at swing to swing) and small picture (as marked on my chart with LH LL)
Ignored

thanks, I can see the LH LL's you marked.
I think yes, reading the bigger picture and smaller picture is something i need to work on.

sometimes i have seen you count the big LH, LL's [bigger picture] to take a trade, but more often I see you using the smaller LH and LL , and more recently sometimes i take the smaller LH and LL trades. sometimes they win, sometimes they don't. I don't always post them. It's clear though that i need more practice in implementing it correctly.

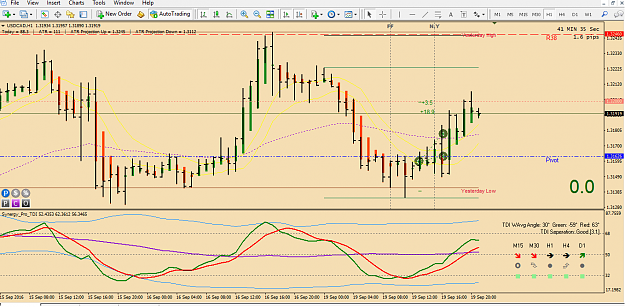
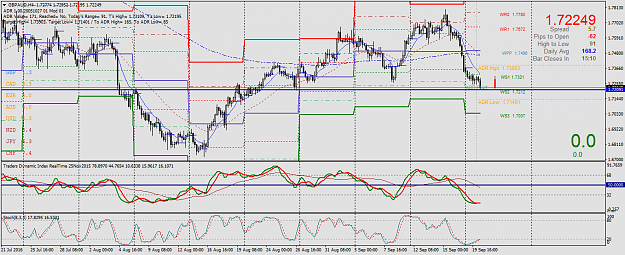
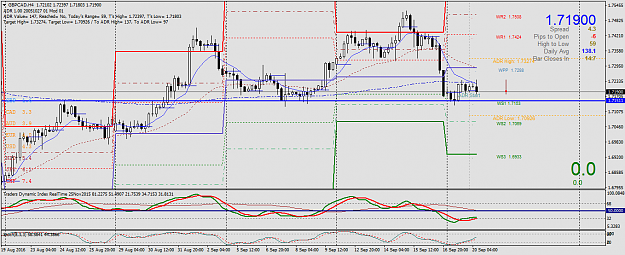
i took a try at reading the big swings [below]
and tbh, with those LH's and LL's drawn in it does seem a bit silly for me to be bullish on the pair
Attached Image (click to enlarge)
Click to Enlarge

Name: HL reading.png
Size: 27 KB
 
 
  • Post #15,662
  • Quote
  • Sep 19, 2016 7:50am Sep 19, 2016 7:50am
  •  pips29
  • Joined Aug 2012 | Status: Member | 16,704 Posts
Quoting likica
Disliked
{quote} welcome back Pips. Hope all is well over there...
Ignored
thanks, I wish you well too
the cautious seldom err....C
 
 
  • Post #15,663
  • Quote
  • Sep 19, 2016 8:19am Sep 19, 2016 8:19am
  •  pips29
  • Joined Aug 2012 | Status: Member | 16,704 Posts
Quoting kain775
Disliked
{quote} Hi, thanks for the feedback also. I will explain why I went long even though TDI was under the mbl, it was because I had support from the brn, and also the 61.8% fib which is drawn on my chart. so as i had multi support i went early without price being above the mbl. Likica often does this. however I now know that I shouldn't be going long at that point in the first place, due to the errors which have pointed out. as for the 34 ema, thanks. I only added it recently tbh, im still a little green on how to use it ...but im guessing price above...
Ignored
It is risky when the tdi is under both the 50 and mbl when going long. I suggest you avoid such trades and trade when it's above the 50 or mbl to go long. At least you have one condition in your favour. Htf, S/r and pa (most important) all contribute to a successful trade..you just need not be the "best" to win in forex....just be good
the cautious seldom err....C
 
 
  • Post #15,664
  • Quote
  • Sep 19, 2016 12:01pm Sep 19, 2016 12:01pm
  •  longbk
  • | Joined Feb 2013 | Status: Member | 181 Posts
PA play double bottom with 2 BUOB, TDI and Stoch over 50
Attached Image (click to enlarge)
Click to Enlarge

Name: Screen Shot 2016-09-19 at 10.57.08 PM.png
Size: 213 KB
 
 
  • Post #15,665
  • Quote
  • Sep 19, 2016 12:38pm Sep 19, 2016 12:38pm
  •  likica
  • Joined May 2012 | Status: Happy trading n enjoy green pips | 5,317 Posts
Quoting longbk
Disliked
PA play double bottom with 2 BUOB, TDI and Stoch over 50 {image}
Ignored
good pipping Longbk
Appreciation is the key to wealth and happiness
 
 
  • Post #15,666
  • Quote
  • Sep 19, 2016 12:42pm Sep 19, 2016 12:42pm
  •  likica
  • Joined May 2012 | Status: Happy trading n enjoy green pips | 5,317 Posts
here is my UCAD moves between S and R for studying and motivational purposes. If you zoom it in and out, you will see reasons for those trades...
Attached Image(s) (click to enlarge)
Click to Enlarge

Name: 16 19.9.16 USDCADM30 +++.png
Size: 96 KB
Click to Enlarge

Name: 16 19.9.16 USDCADM30 +++(Zoomed out for BDIV, BHD).png
Size: 103 KB
Appreciation is the key to wealth and happiness
 
 
  • Post #15,667
  • Quote
  • Sep 19, 2016 1:27pm Sep 19, 2016 1:27pm
  •  kain775
  • | Joined Feb 2016 | Status: Member | 817 Posts
Quoting likica
Disliked
here is my UCAD moves between S and R for studying and motivational purposes. If you zoom it in and out, you will see reasons for those trades... {image} {image}
Ignored


nice shot likica.


sometimes i feel like im so close, yet so far

usd/cad m30

I saw the big swings steeping up,
I saw the price @ support
I saw the small div and was thinking of entering where you entered but i was classing it as a counter trade because of the div and the bullish apb's on h1 wern't that big, so i waiting for HH's/HL's ...and mine looks a bit iffy and i wasn't sure if my HL was legit so i entered with 40% lots. where i entered was pretty close in price to you it turns out. my SL was behind my HL. And thats where I got stopped out. In hindsight perhaps i was being too ambitious to call it a HL and perhaps i should have not thought of the trade as a counter trade.

oh well..., gotta keep practicing i guess.
Attached Image (click to enlarge)
Click to Enlarge

Name: usdcadtrade.png
Size: 38 KB
 
 
  • Post #15,668
  • Quote
  • Sep 19, 2016 1:49pm Sep 19, 2016 1:49pm
  •  kain775
  • | Joined Feb 2016 | Status: Member | 817 Posts
Quoting longbk
Disliked
PA play double bottom with 2 BUOB, TDI and Stoch over 50 {image}
Ignored

I took this as well and won,
originally I was going to wait for the HH's/HL's but i was trying to do what prx62 does and observe the wicks and enter early. It worked in this case and then when finally the HH came i felt a lot more comfortable. price did take quite a while to go up though to the HH so im wondering if i got the phx62 entry wrong ..so not sure if i was lucky here ...but i would have definitely bought on the HH if i was not already in the trade.
 
 
  • Post #15,669
  • Quote
  • Sep 19, 2016 2:11pm Sep 19, 2016 2:11pm
  •  lddd
  • Joined May 2009 | Status: 🛸 | 3,129 Posts
Hello,

i still have some problems setting TMS 1.6 from post 1. I downloaded the package. Extracted Indicators to the right place. Extracted the template (tms 30 min white). Attached the template to some charts.

After that my chart looks like this

Attached Image (click to enlarge)
Click to Enlarge

Name: tms_1.6_template-attached.jpg
Size: 318 KB


Now whats else to do? The Angleator attaching manually to each chart? Well i tried this too but arrows and other data still not updating (stay the same for each chart)

No clue what i am missing. I am quiet new to this at all. Also it seems like people trading this strategy all have different setups.

Would be cool to get some beginners instructions. Looking through all the posts here leads to even more chaos. Seems everyone using different setups, charts, colors, indicators. Little bit confusing to someone who is new to it.

thanks in advance.
 
 
  • Post #15,670
  • Quote
  • Sep 19, 2016 2:27pm Sep 19, 2016 2:27pm
  •  shad4u2
  • | Joined Sep 2014 | Status: FX Student | 181 Posts
Quoting kain775
Disliked
{quote} nice shot likica. sometimes i feel like im so close, yet so far usd/cad m30 I saw the big swings steeping up, I saw the price @ support I saw the small div and was thinking of entering where you entered but i was classing it as a counter trade because of the div and the bullish apb's on h1 wern't that big, so i waiting for HH's/HL's ...and mine looks a bit iffy and i wasn't sure if my HL was legit so i entered with 40% lots. where i entered was pretty close in price to you it turns out. my SL was behind my HL. And thats where I got stopped...
Ignored

Hi Kain775

Market is dynamic and we only try to get our safe pips and maintain our equity that's why I am always trying to partially exit on 20-25 pips and put my SL to Break even+. I am also in same train but miss my final take profit.

Attached Image (click to enlarge)
Click to Enlarge

Name: usdcad m30.png
Size: 65 KB


Thank You.
Newbie
 
 
  • Post #15,671
  • Quote
  • Sep 19, 2016 3:02pm Sep 19, 2016 3:02pm
  •  shad4u2
  • | Joined Sep 2014 | Status: FX Student | 181 Posts
Quoting lddd
Disliked
Hello, i still have some problems setting TMS 1.6 from post 1. I downloaded the package. Extracted Indicators to the right place. Extracted the template (tms 30 min white). Attached the template to some charts. After that my chart looks like this {image} Now whats else to do? The Angleator attaching manually to each chart? Well i tried this too but arrows and other data still not updating (stay the same for each chart) No clue what i am missing. I am quiet new to this at all. Also it seems like people trading this strategy all have different setups....
Ignored

Hi check the indi and template of page 1 and found there is one more folder in Indicator folder name tms 1 and some indicators are located there.
Error in expert tab.
Attached Image (click to enlarge)
Click to Enlarge

Name: error2.png
Size: 88 KB


Attached File(s)
File Type: rar TMS LK-16.rar   180 KB | 461 downloads


Kindly copy and paste all indi in indicator folder and apply the template. enjoy.
Newbie
 
 
  • Post #15,672
  • Quote
  • Sep 19, 2016 3:37pm Sep 19, 2016 3:37pm
  •  lddd
  • Joined May 2009 | Status: 🛸 | 3,129 Posts
Quoting shad4u2
Disliked
{quote} Hi check the indi and template of page 1 and found there is one more folder in Indicator folder name tms 1 and some indicators are located there. Error in expert tab. {image} {file} Kindly copy and paste all indi in indicator folder and apply the template. enjoy.
Ignored
thanks a lot. Looks better now.
 
 
  • Post #15,673
  • Quote
  • Sep 19, 2016 3:39pm Sep 19, 2016 3:39pm
  •  lddd
  • Joined May 2009 | Status: 🛸 | 3,129 Posts
What kind of candle sticks are used, Heiken Ashi?
 
 
  • Post #15,674
  • Quote
  • Sep 19, 2016 8:12pm Sep 19, 2016 8:12pm
  •  lisat
  • Joined Jun 2016 | Status: Member | 888 Posts
Quoting kain775
Disliked
{quote} im sorry lisat but i cannot see a bearish engulfing on h4. here is my naked chart below about the dol, i can see what you mean on the H4. are you saying we must wait for a h4 close of dol? I thought m30 was fine? {image}
Ignored
No I did not mean you have to wait for h4 close what I wanted to say was the higher timeframe (and m30 as well) was very bearish at the time you took the trade. Look at the candle on your chart at 0.00 and the one following at 4:00 this is the defininition of an engulfing candle:

Engulfing candlestick patterns takes two candlesticks to be identified. A bullish engulfing pattern is characterized by a bullish candle whose body, the open and close engulfs the previous candle’s body. Conversely, a bearish engulfing pattern is characterized by a bearish candle whose body engulfs the previous candle’s body.

It is a stronger signal if it also engulfs the wicks but its not necessary. To see that pattern on h4, tdi strongly down, ll and lh on m30 all adds up to lower probability trade.
Success means going from failure to failure without loss of enthusiasm
 
 
  • Post #15,675
  • Quote
  • Sep 19, 2016 11:02pm Sep 19, 2016 11:02pm
  •  NoQuit
  • | Joined Feb 2011 | Status: Member | 54 Posts
Hi Lk,
Just want to know what is criteria for TDI overbought/oversold?
 
 
  • Post #15,676
  • Quote
  • Sep 20, 2016 12:26am Sep 20, 2016 12:26am
  •  birdnest
  • | Joined Feb 2013 | Status: chirp | 200 Posts
Does this below mean a divergence for a bullish trend for GBPUSD?
Attached Image (click to enlarge)
Click to Enlarge

Name: gbpusd-d1-oanda-division7.png
Size: 36 KB
 
 
  • Post #15,677
  • Quote
  • Sep 20, 2016 1:22am Sep 20, 2016 1:22am
  •  likica
  • Joined May 2012 | Status: Happy trading n enjoy green pips | 5,317 Posts
Quoting lddd
Disliked
Hello, i still have some problems setting TMS 1.6 from post 1. I downloaded the package. Extracted Indicators to the right place. Extracted the template (tms 30 min white). Attached the template to some charts. After that my chart looks like this {image} Now whats else to do? The Angleator attaching manually to each chart? Well i tried this too but arrows and other data still not updating (stay the same for each chart) No clue what i am missing. I am quiet new to this at all. Also it seems like people trading this strategy all have different setups....
Ignored
From your pic, you did not have TMS_Angleator V3-RT2 on your indicator list for it to work.

Everyone can use any set up or any color that suits their eyes, as long as no additional indicators beside what attached on post #1.

We use Synergy_APB (some others from original TMS thread use HA). We focus on M30 and price actions together with TDI and stoc to determine our entries. So APB or HA or even normal candlesticks are fine as we don't look at one single candle to get in but the whole pic.

If you decide to give this a go, at least learn the basics (if you have not mastered PA reading) then combine with what have been applied here, for a few months to get familiar with the system. Do a lot of practice and post your trades here to share both winners and losses (if you wish to improve your trading).

Quoting NoQuit
Disliked
Hi Lk, Just want to know what is criteria for TDI overbought/oversold?
Ignored
overbought: around 75 or above
oversold: around 25 or below

Quoting birdnest
Disliked
Does this below mean a divergence for a bullish trend for GBPUSD? {image}
Ignored
I don't think there is any bullish divergence set up on your pic
Appreciation is the key to wealth and happiness
 
 
  • Post #15,678
  • Quote
  • Sep 20, 2016 2:32am Sep 20, 2016 2:32am
  •  birdnest
  • | Joined Feb 2013 | Status: chirp | 200 Posts
Likica, thank you for the reply.


But how do you suss out the right

divergence and not the fake ones?
 
 
  • Post #15,679
  • Quote
  • Sep 20, 2016 3:56am Sep 20, 2016 3:56am
  •  Mudosh
  • | Joined Sep 2015 | Status: Member | 94 Posts
My EU trade took yesterday, 2 positions.
Attached Image (click to enlarge)
Click to Enlarge

Name: EURUSDM30.png
Size: 47 KB
 
 
  • Post #15,680
  • Quote
  • Sep 20, 2016 4:46am Sep 20, 2016 4:46am
  •  pips29
  • Joined Aug 2012 | Status: Member | 16,704 Posts
G/a,G/n are facing support on the 4 hour and Gcad is getting close too after bouncing from there earlier...Any thoughts Likica?
Attached Image(s) (click to enlarge)
Click to Enlarge

Name: GBPAUDH4.png
Size: 67 KB
Click to Enlarge

Name: GBPNZDH4.png
Size: 65 KB
Click to Enlarge

Name: GBPCADH4.png
Size: 57 KB
the cautious seldom err....C
 
 
  • Trading Systems
  • /
  • TMS for M30 charts
  • Reply to Thread
    • 1 782783Page 784785786 922
    • 1 Page 784 922
0 traders viewing now
  • More
Top of Page
  • Facebook
  • Twitter
About FF
  • Mission
  • Products
  • User Guide
  • Media Kit
  • Blog
  • Contact
FF Products
  • Forums
  • Trades
  • Calendar
  • News
  • Market
  • Brokers
  • Trade Explorer
FF Website
  • Homepage
  • Search
  • Members
  • Report a Bug
Follow FF
  • Facebook
  • Twitter

FF Sister Sites:

  • Metals Mine
  • Energy EXCH
  • Crypto Craft

Forex Factory® is a brand of Fair Economy, Inc.

Terms of Service / ©2023