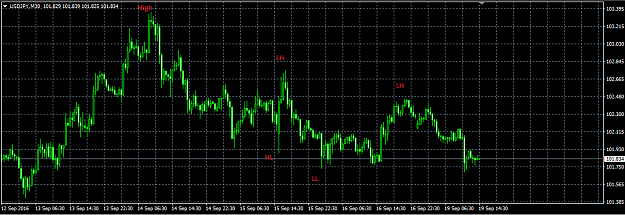
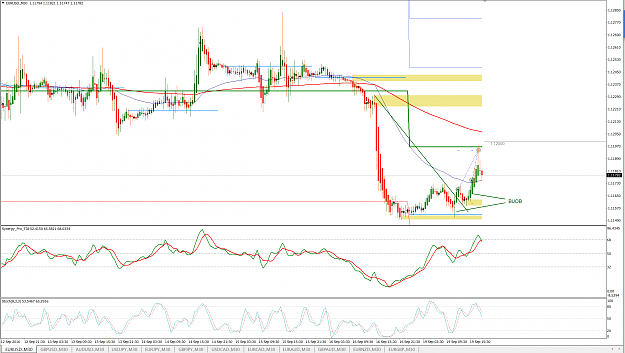
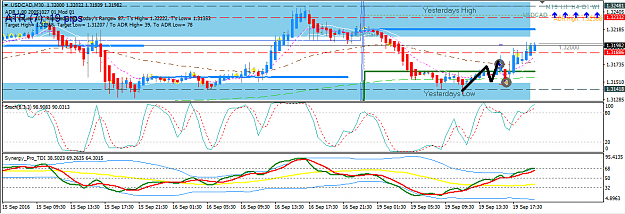
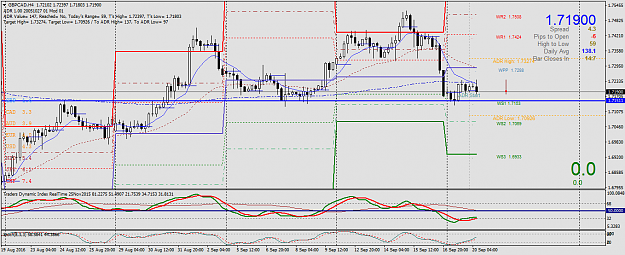
Disliked{quote} if you only focus on pivots or MA or DOL and divergence and hidden divergence by themself , you will fail, unless you look at higher time frames like H4 D1 to buil positions. Your problem is you fail to read price actions around those levels to see if buyers or sellers were strong at that moment, that why you were confused whether to buy or to sell. Can you see that price were stepping down? both big picture (look at swing to swing) and small picture (as marked on my chart with LH LL)Ignored
thanks, I can see the LH LL's you marked.
I think yes, reading the bigger picture and smaller picture is something i need to work on.
sometimes i have seen you count the big LH, LL's [bigger picture] to take a trade, but more often I see you using the smaller LH and LL , and more recently sometimes i take the smaller LH and LL trades. sometimes they win, sometimes they don't. I don't always post them. It's clear though that i need more practice in implementing it correctly.
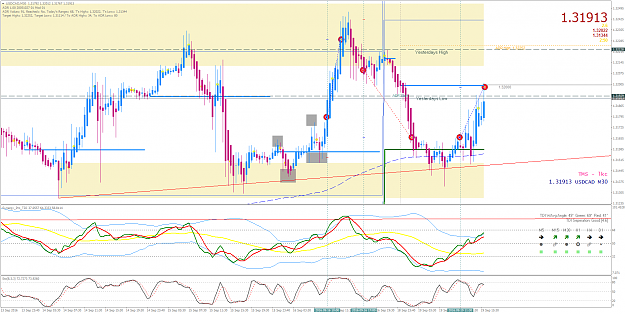
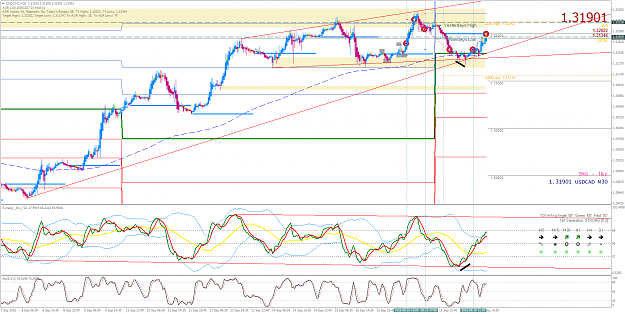
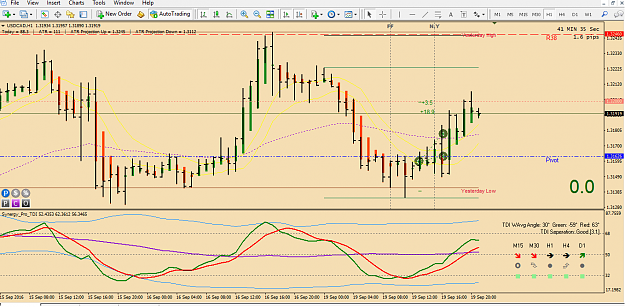
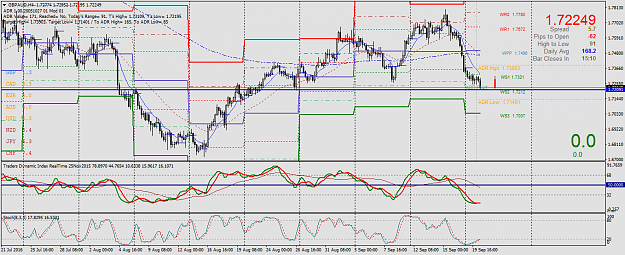
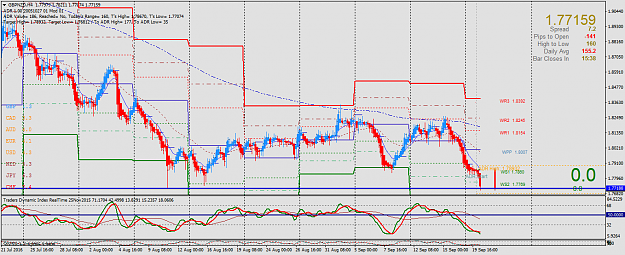
i took a try at reading the big swings [below]
and tbh, with those LH's and LL's drawn in it does seem a bit silly for me to be bullish on the pair
