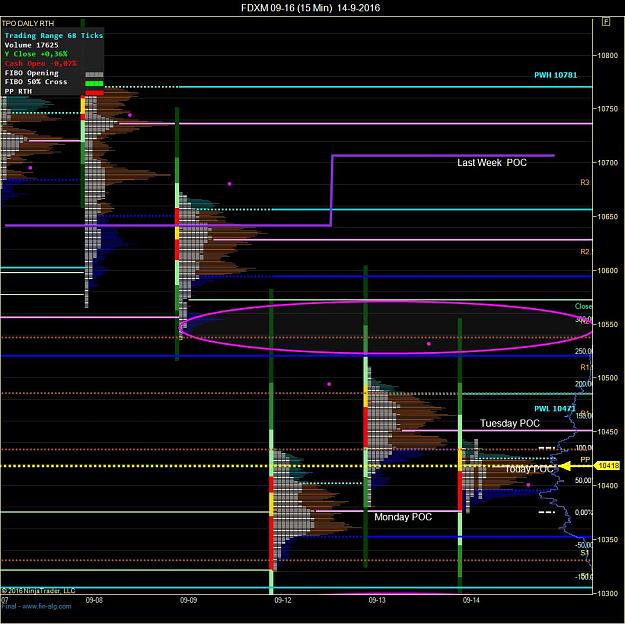
On the Daily TPO chart picture (last post) you see a vertical line colored in red/yellow/ and greens.
The little yellow part is the first 2 minutes traded started from the Cash open.
The red and yellow vertical stripe (together) is the first 60 minutes traded range started from the cash open.
Called the Opening Range or OR. Also called the Initial Balance or IB.
The different green colors are the extensions of the OR.
Like 50%/100%/200%
The pink horizontal lines are the POC lines of the day. (Price Of Control/level where the market is in balance)
The POC line of the previous days are fixed at the end of the days cash close. They do not change anymore.
The today POC line is still developing until the cash close.
Now @ 10.417 and will change from level during the day.
The POC level is NOT the place where the highest Volume is/was.
Each vertical leg of white blocks is a 30 minute period. See it as 30 minute candles/bars.
So it is a compressed 30 minute chart
So easy to see on a Daily TPO chart:
Cash open of several days
Cash close of several days
Daily POC (and previous days POC's)
H/L of several days
Volume peaks
Opening Range
Extensions Opening Range
GAPS between days
GAPS to close
and more
In the same way I look @ a WEEKLY TPO chart.
On the Weekly and Monthly I mainly look/search for light traded area's/zones.
So called Pockets/Gaps to fill.
See Yesterday screenshot of the Weekly TPO charts of ES and YM (S&P and DOW)
You see single white TPO blocks (pockets/Gaps) which in theory still have to be filled.
See it as targets when the markets move down.
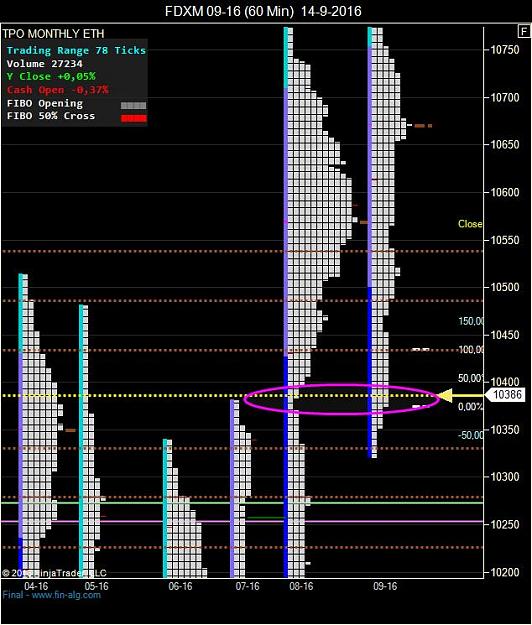
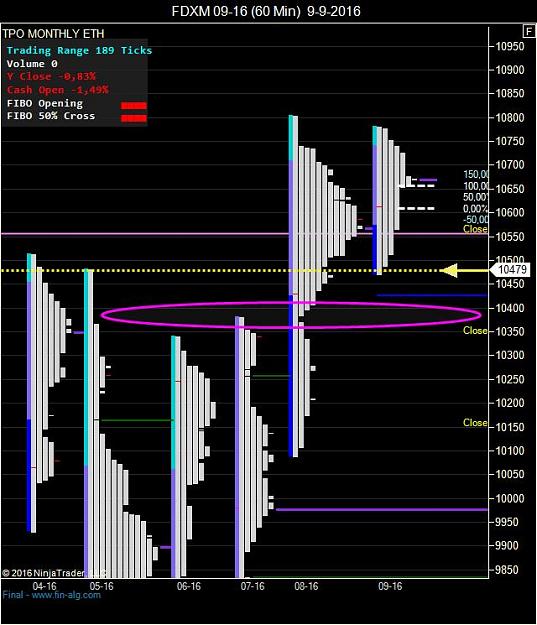
In the same way I look @ (a little less) the MONTHLY TPO chart
See the screenshot of the Monthly DAX chart from Sept 9.
At that time the price was just below the 500 and was looking for the 400/350 to fill the GAP/Pocket (single white TPO blocks) and test the Monthly Highs of August and July.
The little yellow part is the first 2 minutes traded started from the Cash open.
The red and yellow vertical stripe (together) is the first 60 minutes traded range started from the cash open.
Called the Opening Range or OR. Also called the Initial Balance or IB.
The different green colors are the extensions of the OR.
Like 50%/100%/200%
The pink horizontal lines are the POC lines of the day. (Price Of Control/level where the market is in balance)
The POC line of the previous days are fixed at the end of the days cash close. They do not change anymore.
The today POC line is still developing until the cash close.
Now @ 10.417 and will change from level during the day.
The POC level is NOT the place where the highest Volume is/was.
Each vertical leg of white blocks is a 30 minute period. See it as 30 minute candles/bars.
So it is a compressed 30 minute chart
So easy to see on a Daily TPO chart:
Cash open of several days
Cash close of several days
Daily POC (and previous days POC's)
H/L of several days
Volume peaks
Opening Range
Extensions Opening Range
GAPS between days
GAPS to close
and more
In the same way I look @ a WEEKLY TPO chart.
On the Weekly and Monthly I mainly look/search for light traded area's/zones.
So called Pockets/Gaps to fill.
See Yesterday screenshot of the Weekly TPO charts of ES and YM (S&P and DOW)
You see single white TPO blocks (pockets/Gaps) which in theory still have to be filled.
See it as targets when the markets move down.
In the same way I look @ (a little less) the MONTHLY TPO chart
See the screenshot of the Monthly DAX chart from Sept 9.
At that time the price was just below the 500 and was looking for the 400/350 to fill the GAP/Pocket (single white TPO blocks) and test the Monthly Highs of August and July.
Attached Image(s) (click to enlarge)

It's better to be out wishing to be in... than to be in wishing to be out!