• Home
  • Forums
  • Trades
  • News
  • Calendar
  • Market
  • Brokers
  • Login
  • Join
  • User/Email: Password:
  • 5:05am
Menu
  • Forums
  • Trades
  • News
  • Calendar
  • Market
  • Brokers
  • Login
  • Join
  • 5:05am
Sister Sites
  • Metals Mine
  • Energy EXCH
  • Crypto Craft

Options

Bookmark Thread

First Page First Unread Last Page Last Post

Print Thread

Similar Threads

Auction Market Theory and Market Profile 22,207 replies

MarketProfile/Volume Profile/Auction Market Theory indi? 17 replies

ECN && STP && Scalping && Hedging - Broker Review - Oct 2009 24 replies

Auction Market Value Analytics Charts & Data 14 replies

Analytics, recommendations - S&P 500, Euro and other 11 replies

  • Trading Discussion
  • /
  • Reply to Thread
  • Subscribe
  • 1,025
Attachments: Auction Market Value Theory & Analytics
Exit Attachments
Tags: Auction Market Value Theory & Analytics
Cancel

Auction Market Value Theory & Analytics

  • Last Post
  •  
  • 1 3536Page 373839 81
  • 1 36Page 3738 81
  •  
  • Post #721
  • Quote
  • Jul 7, 2016 1:26pm Jul 7, 2016 1:26pm
  •  roughtrader
  • Joined Jan 2011 | Status: Senior Trader | 1,475 Posts
I have a question about standard deviation, I got the values 2.15, 13.6, 34.1 supposedly for the first second and third standard deviation?
I'm trying to figure out how to calculate them based of the market profile. I'm not sure but I suppose it would be a deviation from the POC?
btw, is the VAH and VAL second or is it first standard deviation? this is a bit interesting because apparently,
if we get through a 3:rd deviation there is a 35% chance to get to the 4:th, meaning also a 65% chance of a reversal.
if we get through the 4:th deviation, there is a 80% chance to get to the 5:th deviation
if we get though the 5:th deviation, there is a 100% to get all the way up to the 9:th deviation.
good stuff, the question is, how to implement it together with the Value area and market auction theory?
I'm thinking about creating deviation lines on top of the MP. ideas please.
Bulls are stupid Animals!especially when Im short!
 
 
  • Post #722
  • Quote
  • Jul 7, 2016 5:14pm Jul 7, 2016 5:14pm
  •  mzvega
  • Joined May 2009 | Status: Member | 1,879 Posts
Quoting spyderman
Disliked
MzVega, Came upon your thread through comments on the "Big Ideas" thread. Your comments about S&R struck a note with me. I'm always searching for new ways to look at the markets. Seems like quite a learning curve on the AMVT. You've kindly supplied many resources here (thread, MOM, VBPT, etc.). What would you recommend to get 'up to speed' on the concepts and in what order. And do I necessarily need to delve into MP first? Thanks in advance and I look forward to learning here.
Ignored
I appreciate you taking the time to post. It's not often I comment outside this thread. AMVT runs contrary and refutes the use of TA.

There is quite a learning curve. Dalton author of MOM made a statement along theses lines "What gives profile traders a real edge?........that fact that most wont make it through the "learning process"".

I wouldn't delve in MP, as in trying to take the time trying to apply what your learning into you every day trading. I did that. I spent a few years living & breathing MP. I found I could be profitable with MP, but the time & effort wasnt worth the profits. It took me a couple of years to come to the conclusion I needed to expand my knowledge base on the subject of AMVT.

Imo, MOM is priceless is in its way it explains how the auction process operates, and into the mindset of each of the different market participants. Each of the different participants operate at & respond to very different prices. This is the info I feel everyone should have a basic understanding of. Imo its a must read. Read it for its informational value , dont waste your time trying to apply it to you every day trading. In hindsight, if I was offered that advice I probably could have shaved of few years off of my learning curve. Doing that makes VBPT an easy read.

AMVT is not a form of TA. TA uses a form of qualitative analysis, here we use quantitative analysis which requires the use of data. It really makes for hard learning by always trying to somehow in the back of your mind trying to equate the two. This subject definitely isn't for someone looking for another strategy to add to their TA trading arsenal

But I do recommend reading both books, it would prevent a gap in understanding..
Markets are not efficient, rather they are effective - Jones
 
 
  • Post #723
  • Quote
  • Jul 7, 2016 5:43pm Jul 7, 2016 5:43pm
  •  spyderman
  • Joined Nov 2010 | Status: Snaggin' Some Pips | 2,157 Posts
Quoting mzvega
Disliked
{quote} I appreciate you taking the time to post. It's not often I comment outside this thread. AMVT runs contrary and refutes the use of TA. There is quite a learning curve. Dalton author of MOM made a statement along theses lines "What gives profile traders a real edge?........that fact that most wont make it through the "learning process"". I wouldn't delve in MP, as in trying to take the time trying to apply what your learning into you every day trading. I did that. I spent a few years living & breathing MP. I found I could be profitable with...
Ignored

Appreciate the insight. I've got a little vacation coming up. Think I'll do some 'light' reading.
 
 
  • Post #724
  • Quote
  • Jul 8, 2016 1:47am Jul 8, 2016 1:47am
  •  mzvega
  • Joined May 2009 | Status: Member | 1,879 Posts
I wanted to post a link to the archived CISCO website where you can find about 40 years of AMVT research. It is the source of all the articles posted to the thread. It contains background, empirical research, and detailed instructions of the analysis discussed in the thread. I do recommend having a working knowledge of MP nomenclature and have read VBPT. It would help in understanding the details of Theory & Practices. The site has an enormous amount of info. It has taken me over 5 years to read, digest, and grasp a firm understanding of the subject. There is more info than I could ever find time to post to the thread. I encourage everyone in their own time read as much as they can. There is nothing there that you can read that you cant learn something from, just follow the links.
Occasionally the link doesn’t work, but I usually find it works again after time
I will also post a link in the first post……..

https://web.archive.org/web/20151107...o-futures.com/
Markets are not efficient, rather they are effective - Jones
 
 
  • Post #725
  • Quote
  • Edited 7:50am Jul 8, 2016 3:36am | Edited 7:50am
  •  dljonesFan
  • | Joined Oct 2015 | Status: Member | 159 Posts
Quoting roughtrader
Disliked
I have a question about standard deviation, I got the values 2.15, 13.6, 34.1 supposedly for the first second and third standard deviation? I'm trying to figure out how to calculate them based of the market profile. I'm not sure but I suppose it would be a deviation from the POC? btw, is the VAH and VAL second or is it first standard deviation? this is a bit interesting because apparently, if we get through a 3:rd deviation there is a 35% chance to get to the 4:th, meaning also a 65% chance of a reversal. if we get through the 4:th deviation, there...
Ignored
Hey roughtrader,

this kind of indicator was already programmed.
google "market statistics forexfactory" or "Market Statistics (Volume Histogram, VWAP with SD bands)"

But Iam sure that this has nothing to do with auction market theory methods. And this thread is only about auction market theory by Jones, we dont discuss other methods here...

"[...]is the VAH and VAL second or is it first standard deviation?"
"[...]meaning also a 65% chance of a reversal."

AND I think you dont know anything about market profiling. Please read MOM or some other introductional book before asking such obvious low-qualitiy questions. We dont have time to answer them.

google Dalton, Steidlmayer, Jones

Look trader, I dont want to discourage or offend you. This method is already well researched and expanded by different intelligent real floor and off floor traders for a long period of time. If you realy want to learn this method, study first and then you can think of modification.

greetings
C
 
 
  • Post #726
  • Quote
  • Edited 9:50am Jul 8, 2016 8:07am | Edited 9:50am
  •  JPworks
  • | Joined Jul 2013 | Status: Member | 123 Posts
Quoting dljonesFan
Disliked
{quote} Hey JPworks, how is it going? Any problems dealing with the data sets? Do you know where you can find the csv files? greetings C
Ignored
Chris,
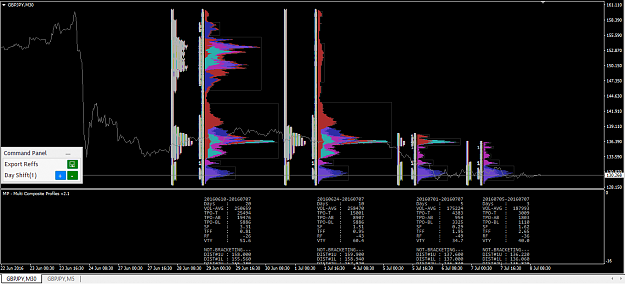
I am so exhausted reading a lot for the last 4 days (not enough sleep) including the forum particularly post 150 to 220. I had been asking so far what I don't know. You see I came directly from chart analysis with fancy indicators and data analysis is foreign for me. I walked through illusion of chart analysis like so many without knowing what is on the background (AMVA). Now I understood in theory the difference of MP, Meta P, VA and composite. Now I need some clarifications of some legends.
1. The sequence of the overlay currve 5 colors in the chart of the upper pane
2. A legend of the lower pane specifically what measurement am I looking when I see some figures TPO AB, TPO BL, TFF, SF, RF

I knew where to find csv files except how to limit information as it download a lot way back historical data. I also need how to organize data that I only need as a day trader.
Thanks for this forum
JP
Attached Image (click to enlarge)
Click to Enlarge

Name: Image 1 m.png
Size: 48 KB
 
 
  • Post #727
  • Quote
  • Edited 9:06am Jul 8, 2016 8:23am | Edited 9:06am
  •  dljonesFan
  • | Joined Oct 2015 | Status: Member | 159 Posts
Quoting JPworks
Disliked
{quote} Chris, I am so exhausted reading a lot for the last 4 days (not enough sleep) including the forum particularly post 150 to 220. I had been asking so far what I don't know. You see I came directly from chart analysis with fancy indicators and data analysts is foreign for me. I walked through illusion of chart analysis like so many without knowing what is on the background (AMVA). Now I understood in theory the difference of MP, Meta P, VA and composite. Now I need some clarifications of some legends. 1. The sequence of the 5 colors in the...
Ignored
Hey JPworks,

thank you for your clear questions. The indicator was not programmed by myself. All my wisdom is from the articles published by Jones on his website and presented by MzVega.

"1. The sequence of the 5 colors in the chart of the upper pane"

Each day the composite profile updates. Every day has a different colour. So you can cleary identify the development over time (daily time periods).

"2. A legend of the lower pane specifically what measurement am I looking when I see some figures TPO AB, TPO BL, TFF, SF, RF"

This is what I know from the articles here in this thread:

TPO - time/price opportunity
TPO AB - tpo count above poc
tpo BL - tpo count below poc
TFF - trade faciliation factor
SF - shape factor
RF - Rotation factor

you will find enough info about this reference points in this thread.

"I knew where to find csv files except how to limit information as it download a lot way back historical data. I also need how to organize data that I only need as a day trader."

It takes a long time to export the data for the first time, because the indi must start to build a data set of the last years (guess- Iam not a prgrammer). After that it will go much quicker.

This is from the articles here in this thread:

Daytrading= getting in today and out (not holding for few days).
So every trade (every breakout/responsive trade) starts with a daytrade. You decide when to exit.

For start you should have a look at all the tfs. As I suggested go back to the last balance break and study the behaviour of the profiles (graphic and csv data). You will clearly notice the change in market action by checking the reference points for change. How doese these reference points change as the last movement stopps, starts to build a bracket, tests and breaks. Always use the articles here presented by Mzvega to compare your findings. For example how doese the TFF change? Its the easiest and quickest way to learn the method because you can see it with your own eyes and not try to understand it by only reading. Always do reading and analysing together.

Please have a look at Mzvegas presentations. I mean the entries with screenshots. There you can clearly see what you need.

greetings
C
 
 
  • Post #728
  • Quote
  • Jul 8, 2016 10:09am Jul 8, 2016 10:09am
  •  mzvega
  • Joined May 2009 | Status: Member | 1,879 Posts
Quoting JPworks
Disliked
{quote} Chris, I am so exhausted reading a lot for the last 4 days (not enough sleep) including the forum particularly post 150 to 220. I had been asking so far what I don't know. You see I came directly from chart analysis with fancy indicators and data analysis is foreign for me. I walked through illusion of chart analysis like so many without knowing what is on the background (AMVA). Now I understood in theory the difference of MP, Meta P, VA and composite. Now I need some clarifications of some legends. 1. The sequence of the overlay currve...
Ignored
Well I see Chris did an excellent job in answering your questions, may I add that

You can find a detailed explanation of TFF in this post which contains a pdf.

http://www.forexfactory.com/showthre...23#post7545523

Detailed info regarding Rotation Factor can be found in MOM pp.112-113,178

SF shape factor is a measurment of how well the shape of the distribution fits the bell shaped model . Thats one of the least used refs that I use. You can visually determine that by looking at profile

When in doubt you can always reference the index in either MOM & VBPT..
Markets are not efficient, rather they are effective - Jones
 
 
  • Post #729
  • Quote
  • Jul 8, 2016 11:49am Jul 8, 2016 11:49am
  •  mzvega
  • Joined May 2009 | Status: Member | 1,879 Posts
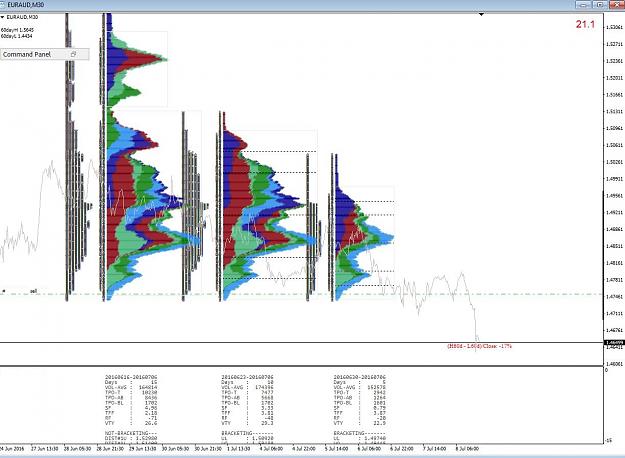
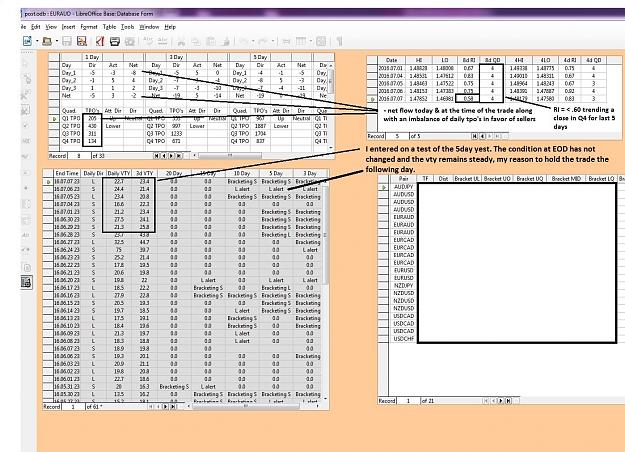
Here is a trade I took yesterday. If traded as a day trade yest it could have been a profitable trade if closed before EOD. I try to get the most out of my trades and continued to hold because the condition of the market had not changed.
Attached Image (click to enlarge)
Click to Enlarge

Name: EURAUD.JPG
Size: 226 KB

Since the condition of the market has not changed, the opportunity for continuation is high, would also make for an opportunity for another profitable day trade today.

If at EOD the condition of the market hasnt change I may continue to hold, if not I'll exit the trade.. Again I let the data determine my actions.

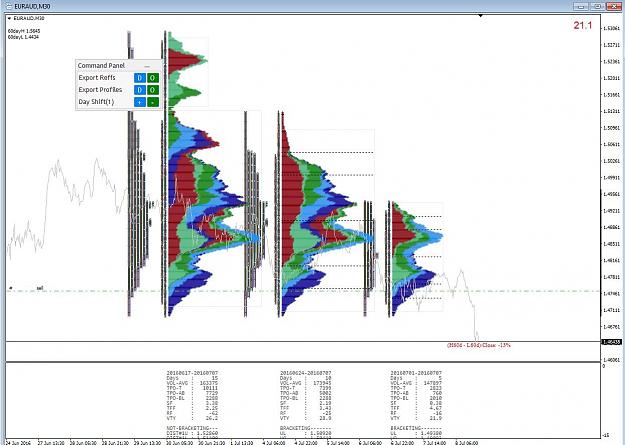
The trade today, presented an opportunity for both short & LTF traders. I was early with my entry. What I do love about the data is that you can identify small changes in the market before you see them reflected on the chart. By the time you identify or recognize a pattern on the chart (you have no idea until upon completion of the pattern) you have missed the majority of the move. You want to identify changes in the market early. By the time you identify and see the actual changes reflected on the chart it is usually to late and the trade is often badly positioned......
Attached Image (click to enlarge)
Click to Enlarge

Name: euraud next day.JPG
Size: 232 KB

Attached Image (click to enlarge)
Click to Enlarge

Name: euraud2.JPG
Size: 431 KB
Markets are not efficient, rather they are effective - Jones
 
 
  • Post #730
  • Quote
  • Jul 8, 2016 2:35pm Jul 8, 2016 2:35pm
  •  mzvega
  • Joined May 2009 | Status: Member | 1,879 Posts
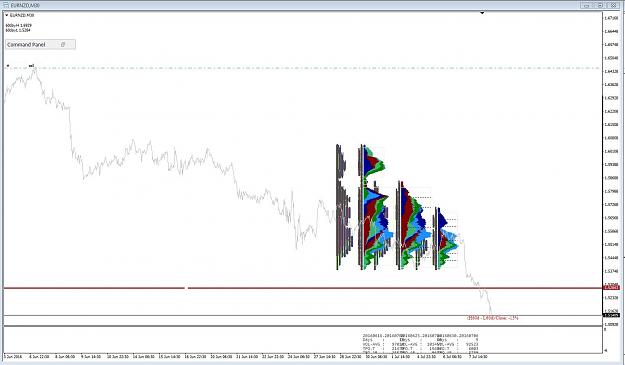
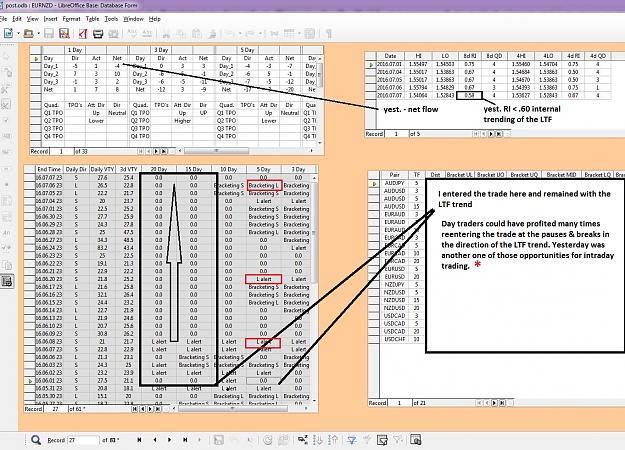
Update....... I am still holding my eurnzd trade taken on 5/31. The original entry would have made a great day trade. Trading the breaks & pauses during the LTF trend as a day trader one could have profited on every leg down. Every trade regardless of TF as Chris pointed out begins as a Day trade. So there is no difference in the data used. The goal is to catch the start of a new trend.

The greatest profit potential is getting into the start of a trending market. As a day trader that trade carries greater profit potential than trying to trade micro trends out of micro balances (daily & shorter tf's). I am not saying that you cant trade those, be aware of the risks, I only look for trades that carry the greatest profit potential.

Due to the intraday fluctuations in price those micro trends & breaks are short lived and can quickly reverse and the profit potential greatly reduced at a much greater risk. My point of the post is the same data is used. As you learn to read the data you grow more confident and you can use the same info to decide to hold the position for longer periods of time, or to re enter the trend several times as a day trader.

Yesterdays eurnzd chart would have made a great day trade.
Attached Image(s) (click to enlarge)
Click to Enlarge

Name: eurnzd.JPG
Size: 176 KB
Click to Enlarge

Name: eurnzd2.JPG
Size: 462 KB
Markets are not efficient, rather they are effective - Jones
 
1
  • Post #731
  • Quote
  • Jul 8, 2016 3:07pm Jul 8, 2016 3:07pm
  •  JPworks
  • | Joined Jul 2013 | Status: Member | 123 Posts
Mzvega and Chris,
Thank you for walking me through, you are angels what can I say. I am assimilating what you have posted. I believe I have grasped the main theme way more than 50%. Now the remaining is having organize the data sheet and gaze the data and the flow of market information incorporating with the MP composite. You gave me before the link for the excel main s sheet, how do I organize the way you organize it? This seems I have to do the next step and then familiarize myself with the data flow to take action of day trading or longer. I am fortunate to be in the right place and I can't thank you enough. I feel I can reverse the many discouragements I faced through the battle field of trading.
JP
 
 
  • Post #732
  • Quote
  • Edited 3:38pm Jul 8, 2016 3:18pm | Edited 3:38pm
  •  mzvega
  • Joined May 2009 | Status: Member | 1,879 Posts
Quoting JPworks
Disliked
Mzvega and Chris, Thank you for walking me through, you are angels what can I say. I am assimilating what you have posted. I believe I have grasped the main theme way more than 50%. Now the remaining is having organize the data sheet and gaze the data and the flow of market information incorporating with the MP composite. You gave me before the link for the excel main s sheet, how do I organize the way you organize it? This seems I have to do the next step and then familiarize myself with the data flow to take action of day trading or longer. I...
Ignored
Have you read VBPT? Are you familiar with the examples used in the book? What data we're looking for and why?

You should read this first
https://web.archive.org/web/20100716200427/http://www.cisco-futures.com/daytradingengine_tickstudy.html

https://web.archive.org/web/20100716165130/http://www.cisco-futures.com/daytradingengine_flow_example1.html

https://web.archive.org/web/20140401053959/http://www.cisco-futures.com/daytradingengine_flow_example2.html
Markets are not efficient, rather they are effective - Jones
 
 
  • Post #733
  • Quote
  • Jul 8, 2016 6:57pm Jul 8, 2016 6:57pm
  •  spyderman
  • Joined Nov 2010 | Status: Snaggin' Some Pips | 2,157 Posts
Mzvega


Started reading MOM. Interesting
Quick question on figures 3-3 & 3-4 pgs 47,48. It seems that some of the labels may be incorrect. We wouldn't have responsive buying above value or responsive selling below value would we

Probably a minor point but I wanted to be clear with myself that there might be typos so I won't go crazy trying to figure out where I got it wrong
Thanks

EDIT: Nevermind. I just realized the responsive/initiative is in relation to yesterday's value, not current day (prob cause we don't know today's value till eod).
 
 
  • Post #734
  • Quote
  • Edited 11:58am Jul 9, 2016 11:45am | Edited 11:58am
  •  JPworks
  • | Joined Jul 2013 | Status: Member | 123 Posts
Quoting mzvega
Disliked
{quote} Have you read VBPT? Are you familiar with the examples used in the book? What data we're looking for and why? You should read this first https://web.archive.org/web/20100716200427/http://www.cisco-futures.com/daytradingengine_tickstudy.html https://web.archive.org/web/20100716165130/http://www.cisco-futures.com/daytradingengine_flow_example1.html...
Ignored
Mzvega,
What data we're looking for and why?
I am afraid whether I will answer your question correctly as you lead me to a complex data. For a one who was in the habit of PT (price time - candle), Tick (number of traded transactions) and renko based chart day trading (which is called by AMVA noize day trading) the question of data is tricky because I have seen many including myself ask questions what we don't understand. I was once involved in PVTA (price volume time analysis) trading but had many questions than answers as volume is arbitrary in the forex world. If at all there is volume and tick, whose volume and whose tick in un-centralized trading world any way? Even for that, there is not such thing - Profiling.

I am not answering your question here but I am answering to show you whether I have the capacity of understanding to follow what you are addressing in this forum and not waste your precious time. In a nutshell when I say data, I meant two things. One the data in the spread sheet mentioned above. Second The Tick (price, price increment, sequence and frequency). This is the best alternative to MP and VP which can be considered as universal for every market. Understanding the auction process, understanding the data (The Tick) and profiling the market data and translate it into graphical structural organization is so powerful. And I am sold out and I chose the value based day trading and come out from the noize. I am reading what you sent me. Thank you. IP
 
 
  • Post #735
  • Quote
  • Jul 9, 2016 2:38pm Jul 9, 2016 2:38pm
  •  Sandile
  • Joined Dec 2013 | Status: Member | 116 Posts
Quoting mzvega
Disliked
{quote} First what indicator are you using? Are you trying to apply "Market Profile" methodology? "MP" is exclusive to futures and applies to intraday trading trading that doesnt consist of holding overnight. "Auction Market Value theory" applies to 24h "tick based" markets. There is no 70% "Value Area" in AMVT, that is an "intraday" concept. This also is not a Volume distribution, its a "Frequency" distribution of prices AMVT uses TPO count to determined where the distribution begins & ends "Market Profile" is a intraday concept, AMVT concept is...
Ignored
Hi Mzvega,

I know that you made it clear that this is not a Market Profile Thread and I apologise for having to ask you the following,

1. Do you by any chance still have the TPO Indicator you made an illustration with on the Picture you attached on this post, if you do, could you please share it with...
2. Have you in the past traded using the Market Profile?
 
 
  • Post #736
  • Quote
  • Jul 9, 2016 3:48pm Jul 9, 2016 3:48pm
  •  mzvega
  • Joined May 2009 | Status: Member | 1,879 Posts
Quoting Sandile
Disliked
{quote} Hi Mzvega, I know that you made it clear that this is not a Market Profile Thread and I apologise for having to ask you the following, 1. Do you by any chance still have the TPO Indicator you made an illustration with on the Picture you attached on this post, if you do, could you please share it with... 2. Have you in the past traded using the Market Profile?
Ignored
The indicator used in that post is not a "market profile" indicator. A MP trader would have no interest in it. I believe a link was posted in the MP thread.

Yes I have traded MP in the past. The MP indicator I used for that I purchased.
https://www.mql5.com/en/market/product/3033
Markets are not efficient, rather they are effective - Jones
 
 
  • Post #737
  • Quote
  • Jul 9, 2016 9:26pm Jul 9, 2016 9:26pm
  •  mzvega
  • Joined May 2009 | Status: Member | 1,879 Posts
Quoting roughtrader
Disliked
{quote} Please read MOM or some other introductional book before asking such obvious low-qualitiy questions. We dont have time to answer them. We? who is we? are you in the golden club of market profile here? since when did standard deviations become a low quality question? did you just learn what a TPO is and now you feel so coocky about it? Please come down to earth! don't be such an asshole, btw, if you don't know the answer, don't pretend that you do, by answering my post with such bullshit, you are a rude little shit!
Ignored
.

This is not a MP thread. And the MOM book which is referred to has nothing to do with standard deviations. Your welcome to download & read it for yourself. I know you probably learn MP from a bunch 10 minute youtube videos, webinars used to promote some kind of subscription service. But we here, for the topic of conversation refer to Dalton's MOM book, so everyone is working with the same set of facts.

If you had taken the time to read the first post you would realize this is not a Market Profile thread and that you could have instead posted your questions to the MP thread where your fellow MP traders could answer those questions for you. I think the person or source who taught you about std. dev's would be best able to address your questions. As this thread has nothing to do with MP or Gaussian distribution analysis

I find it rude to post a comment in thread without having read it first. If you had you would have realized your question was off topic. There was a reason I didn't respond to your post..........

As I stated in the first post in Huge Red Letters this is not a MP thread
http://www.forexfactory.com/showthread.php?t=482744
Markets are not efficient, rather they are effective - Jones
 
 
  • Post #738
  • Quote
  • Jul 9, 2016 9:59pm Jul 9, 2016 9:59pm
  •  trickshady
  • | Joined Nov 2010 | Status: Member | 156 Posts
Interesting approach, but I think you are way overcomplicating trading.
 
 
  • Post #739
  • Quote
  • Jul 9, 2016 10:25pm Jul 9, 2016 10:25pm
  •  mzvega
  • Joined May 2009 | Status: Member | 1,879 Posts
Quoting trickshady
Disliked
Interesting approach, but I think you are way overcomplicating trading.
Ignored
TA uses a form of "qualitative" analysis . I prefer to use "quantitative" analysis.
I personally don't let a little extra effort, scare me into taking the path of least resistance.
You're welcome to read through the thread, you might find the logic reasonable.....and then again..... you might not.

Auction Market Value Analytics/Auction Market Value Theory has it's own rules & permitted practices as permitted by theory. Not dictated by me.
Again you are welcome to read the thread.......or not
Markets are not efficient, rather they are effective - Jones
 
 
  • Post #740
  • Quote
  • Jul 9, 2016 10:46pm Jul 9, 2016 10:46pm
  •  trickshady
  • | Joined Nov 2010 | Status: Member | 156 Posts
I skimmed through it, read about it online and it actually makes lots of sense but I still think it's overcomplicated. I don't use TA, FA or auction market value theory.
 
 
  • Trading Discussion
  • /
  • Auction Market Value Theory & Analytics
  • Reply to Thread
    • 1 3536Page 373839 81
    • 1 36Page 3738 81
0 traders viewing now
  • More
Top of Page
  • Facebook
  • Twitter
About FF
  • Mission
  • Products
  • User Guide
  • Media Kit
  • Blog
  • Contact
FF Products
  • Forums
  • Trades
  • Calendar
  • News
  • Market
  • Brokers
  • Trade Explorer
FF Website
  • Homepage
  • Search
  • Members
  • Report a Bug
Follow FF
  • Facebook
  • Twitter

FF Sister Sites:

  • Metals Mine
  • Energy EXCH
  • Crypto Craft

Forex Factory® is a brand of Fair Economy, Inc.

Terms of Service / ©2023