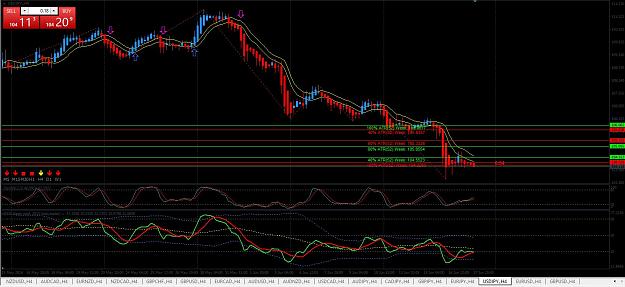
{quote} You must know about indicator on post #68,646 that i create base on Emm Post #68,585 and #68,609. So, its nothing wrong with that indicator. But, if you want it calculated base on High/Low of current week, try this one. I made custom indicator for anyone who need ATR(52) week representated on chart by horisontal line, divided to 40%, 60%, and full 100% for each direction. hope its usefull, enjoy! {image} {file}
Ignored
Hey bridgeWater,
First I think you so much for your time that you spent to make this indicator.
I got 3 questions and I hope you can help me with them
1- if you look at my charts you can see the ATR52 lines are above the price action bars. which for me is just more noise or hard to see the price action. My question is, How can I place these lines to be BEHIND the APB?
2- Is there a way to change the colors? ( this is not as important as the first question)
3- Is it possible to change the text from "60% ATR(52) Week: 1.1158" to just "60%"? (for all lines 40%....60%...100%..etc) just to make the chart looks cleaner.( this is not as important as the first question)
-53 pips. I thought it broke out of WRB and went down. I should wait for next candle to confirm WRB break out. Patience!!!!!
Still holding this trade fore better exit.
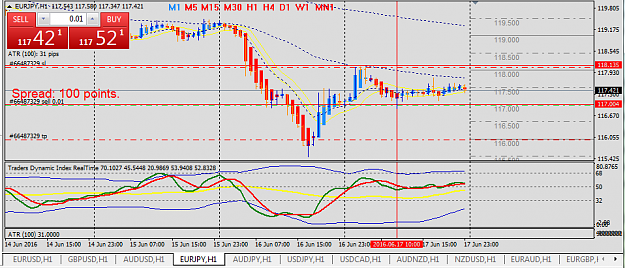
-53 pips. I thought it broke out of WRB and went down. I should wait for next candle to confirm WRB break out. Patience!!!!! Still holding this trade fore better exit. {image}
Ignored
HI,
you were shorting into the DOL [daily open line] [make sure you get that indi], also you were shorting into a BN 117.000, also if you switch to candles and look on june 16th you will see a green bullish bar where the body is 83 pips long and has a wick at the top, it lands just below the 117.000, notice how the next 5 candles basically stood stuck there and couldn't move lower implying that this had turned to support. when you shorted not only were you shorting into the DOL, and BN, but also shorting into support. what you should have done was wait to see if price could break 117.000 first and then if it did THEN short.
{quote} HI, you were shorting into the DOL [daily open line] [make sure you get that indi], also you were shorting into a BN 117.000, also if you switch to candles and look on june 16th you will see a green bullish bar where the body is 83 pips long and has a wick at the top, it lands just below the 117.000, notice how the next 5 candles basically stood stuck there and couldn't move lower implying that this had turned to support. when you shorted not only were you shorting into the DOL, and BN, but also shorting into support. what you should have...
Ignored
Excellent !!! much appreciate your comment. I should also look at candle stick as well.
Make sense!!!
Before go to work
Gold +7pips with 3lots at the moment hopefully going up
BPP for GU - Possible buy at the moment
Weekly - pin bar, reversal confirmation when candle closes above 10 ema
Daily - 1. closed above 10ema
2. Engulfed candle over pin bar (continuation)
3. closed at same level with support 1.4300
4. watch out resistance 50ema 1.44675 & 1.45248
5. TDI & Sto crossed up at 32 & 20
Feel free to feedback I might be wrong too.
Best regards,
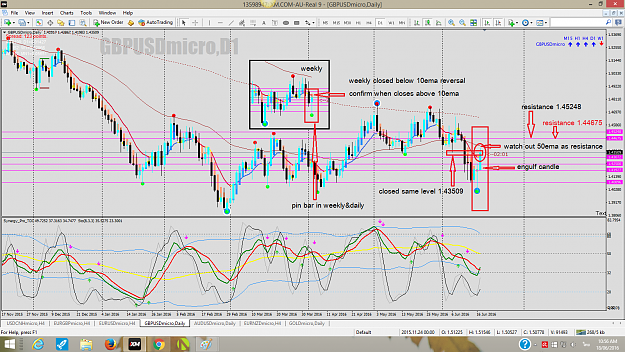
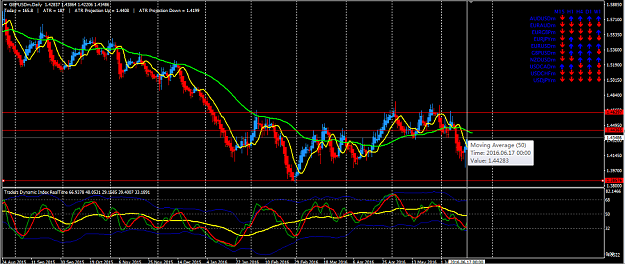
Before go to work Gold +7pips with 3lots at the moment hopefully going up BPP for GU - Possible buy at the moment Weekly - pin bar, reversal confirmation when candle closes above 10 ema Daily - 1. closed above 10ema 2. Engulfed candle over pin bar (continuation) 3. closed at same level with support 1.4300 4. watch out resistance 50ema 1.44675 & 1.45248 5. TDI & Sto crossed up at 32 & 20 Feel free to feedback I might be wrong too. Best regards, {image}
Ignored
I wouldn't long just yet. Look on your daily chart, right where you have your smallest rectangle look left, GBP/USD is right on daily resistance. IMO there is a good chance it will go through it as the candle closed at it's high, but it's a bit premature to long on the daily just yet. I was in a buy trade for gbp/usd on h4 and took it upto this point which was also a H4 resistance
{quote} I wouldn't long just yet. Look on your daily chart, right where you have your smallest rectangle look left, GBP/USD is right on daily resistance. IMO there is a good chance it will go through it as the candle closed at it's high, but it's a bit premature to long on the daily just yet. I was in a buy trade for gbp/usd on h4 and took it upto this point which was also a H4 resistance
Ignored
Hi Kain775
Can you share the reasoning behind this H4 GDP/USD buy trade ?
{quote} Hi Kain775 Can you share the reasoning behind this H4 GDP/USD buy trade ? Thanks!!!
Ignored
this is counter trend,
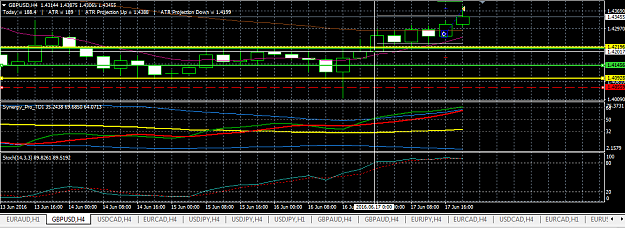
firstly look on D1, we have an inside bar on the 15th, on the 16th we have a failed inside bar breakout to the downside resulting in a bullish pinbar. without the last daily candle being bullish i would not have taken this trade, let me make that clear. now on h4 is you look at my chart you will see the naked candles. the yellow lines are h4 support, the green is h1 support. I can't remember how far back i went to draw them from on this chart but i think atleast the yellow lines are fairly recent.
next look at the TDI, we have a cross above the MBL, but i do not take the trade until after price has closed above the support. the white vertical line is where i think the original cross appeared at the candle. had price not been able to close above the support i wouldn't take it. now the fact that we have closed above support on h4 and have a bullish daily candle the day before leads me to believe price will make it upto the next H4 support [not shown on this chart], so i took the trade. you can see on my chart there is a blue arrow showing where i entered and exited. I prefer the little circle symbol, if anyone knows how to change it please let me know. Lately I have been getting a bit better at TMS, i'm in and out of multiple TMS threads trying to learn what I can. have spent a lot of time over the past few days looking at lastingwells thread, also had spent time before in Likica's thread, also a bit in Aussies thread, originally I started off in this thread, currently you will find me mostly in the stress free TDI thread.
Before go to work Gold +7pips with 3lots at the moment hopefully going up BPP for GU - Possible buy at the moment Weekly - pin bar, reversal confirmation when candle closes above 10 ema Daily - 1. closed above 10ema 2. Engulfed candle over pin bar (continuation) 3. closed at same level with support 1.4300 4. watch out resistance 50ema 1.44675 & 1.45248 5. TDI & Sto crossed up at 32 & 20 Feel free to feedback I might be wrong too. Best regards, {image}
Ignored
Hi,pete.
My question is why resistance 50ema is 1.44675 but not 1.4440 or other price?
Where should i put the resistance and support line(candle close or high)?
thanks.
Attached Image (click to enlarge)
Keep DISCIPLINE, control RISKS, and don't destroy your DREAM easily.
{quote} this is counter trend, firstly look on D1, we have an inside bar on the 15th, on the 16th we have a failed inside bar breakout to the downside resulting in a bullish pinbar. without the last daily candle being bullish i would not have taken this trade, let me make that clear. now on h4 is you look at my chart you will see the naked candles. the yellow lines are h4 support, the green is h1 support. I can't remember how far back i went to draw them from on this chart but i think atleast the yellow lines are fairly recent. next look at the...
Ignored
It's crystal clear!!! I always curious about how other traders tackle counter trend trading and it's really good lesson for me.
Somehow, when I look at naked candle chart, I feel more clear about the S/R. Is it the reason why you use naked candle chart rather than APB chart ?
Again, thanks for your effort to explain your thought process.
{quote} It's crystal clear!!! I always curious about how other traders tackle counter trend trading and it's really good lesson for me. Somehow, when I look at naked candle chart, I feel more clear about the S/R. Is it the reason why you use naked candle chart rather than APB chart ? Again, thanks for your effort to explain your thought process.
Ignored
hi, I actually now use both candle and abp, it's just a lot of the time it's obvious to me now if a candle is going to be a red abp or blue so not always I will need to use ABP to check. Whenever I see a potential setup now I switch to candle's and make sure I have my support and resistance lines drawn in from the 1 hour chart to D1 chart. IMO THIS IS ESSIENTIAL. And is where I was going wrong previously, It is essential you know the support and resistance on your charts, If you don't then time and time and again your trade will go against you because you were buying and selling into support and resistance. Ofcourse I knew about support and resistance prior, ..I knew about it, but failed to appreciate the sheer gravity of support and resistance and if a level didn't jump out to me in an obvious way on my APB chart I wouldn't take much notice. the gravity of support and resistance only really clicked with me recently due to another trader describing support and resistance lines like road blocks in the way of your trades. It is difficult to properly see the support and resistance levels when the ABP's are overlapping the candles, sometimes the APB's do a pretty good job of masking them, I find personally it is better for me to take the ABP's off when searching for support and resistance levels ..then put them back on after if i want.
The counter trend trading tip I recently learned was from lastingwell's thread. Sadly she is no longer with us, I only learned this like a week ago, I am grateful though for the time she took to try and help others. I think different people take different approaches to counter trend setups, Likica often trades counter trend but i'm not sure if she uses that same method, she usually sells at resistance with divergence whereas lastingwell would often not necessarily wait for price to come to a resistance level before selling. if price is on a resistance level and the resistance level has divergence and one is thinking about selling if a person has gone over their chart and knows the other support and resistance in their potential path it may not even be necessary to use that counter trend trading tip [i don't know].
I encourage you though to look around FF and not just stay confined to the TMS thread. Emmanuel is very knowledgeable, but getting different perspectives from others is important too, there are a lot of knowledgeable people here at FF with different TMS trading styles and it may be possible to combine styles or you may find you bump into another trader who explains something to you that you have heard a million times before but he explains it in such a way that you are able to fully grasp and appreciate what he is saying.
Every time I install pipware, my MT4 starts to work extremely slow and at times unresponsive. Emmanuel, can you tell me the best hardware requirements to make this work normally? I am also running 17 charts, but it only takes to install on one of the chart and boom, "MT4 is not responding"
{quote} Hi Zack, Good that you learn and trade the Day chart timeframe. This is the most lucrative timeframe to trade and is less susceptible to market noise which you will see in lower timeframes like H1 and below. Trading the Day chart TF also means you need not be stressed out thinking of what to do when there are data release and news which happens often during the hourly market hours. Many newbie traders also find that there are many false signals when they trade H1 because they have not learned that TMS is not about trade signals generated...
Ignored
@emmanuel:
Thanks a lot for your detailed Explanation.
Sorry for the delay.
I have a question about your question"Do you have a favourite volatility indicator to use?"
Not at this time .Would you please give me a hint which one is best to use?
Thanks.
And 1 more from my side: Do you trade exclusively @ Support and Resistances -Levels or do you take trades between them at specific times?
Thanks for your Input.
Regards Zack
{quote} hi, I actually now use both candle and abp, it's just a lot of the time it's obvious to me now if a candle is going to be a red abp or blue so not always I will need to use ABP to check. Whenever I see a potential setup now I switch to candle's and make sure I have my support and resistance lines drawn in from the 1 hour chart to D1 chart. IMO THIS IS ESSIENTIAL. And is where I was going wrong previously, It is essential you know the support and resistance on your charts, If you don't then time and time and again your trade will go against...
Ignored
"you have heard a million times before but he explains it in such a way that you are able to fully grasp "
It was an "AH-HA" moment for me. I will certainly check other TMS styles.
Have a great weekend !!!
{quote} Hi,pete. My question is why resistance 50ema is 1.44675 but not 1.4440 or other price? Where should i put the resistance and support line(candle close or high)? thanks. {image}
Ignored
Hi Bluesky
Sorry if I didn't make it clear - resistance at 50ema on daily chart level at the moment 1.44091
possible resistance 2 levels 1.44675 & 1.45248 (look at my chart) these 2 levels I drew on monthly line chart when I was doing weekly BPP Plan.