♈![]() ► #Financial #Markets #Observatory #Lab. ◀
► #Financial #Markets #Observatory #Lab. ◀![]() ♈
♈
By ORCID: 0000-0001-5086-7401
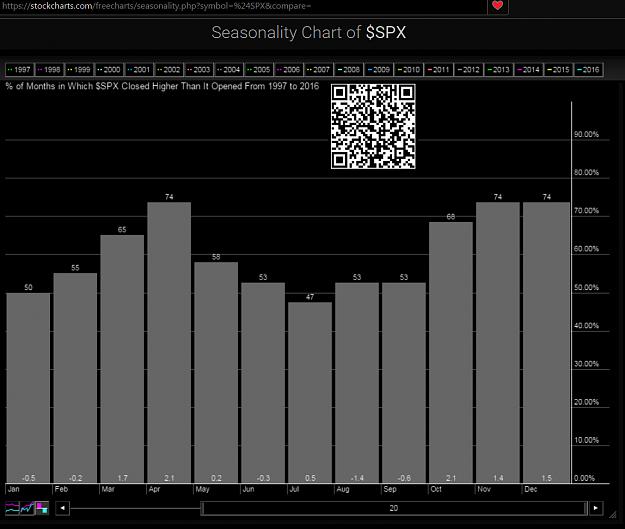
Notes and charts about the Current Levels of some Breadth Indicators of NYSE Stock Market.
☒ Aim of the post.
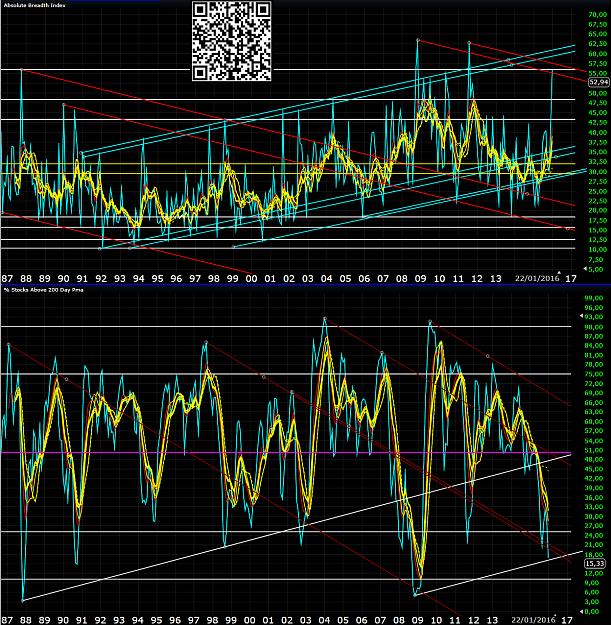
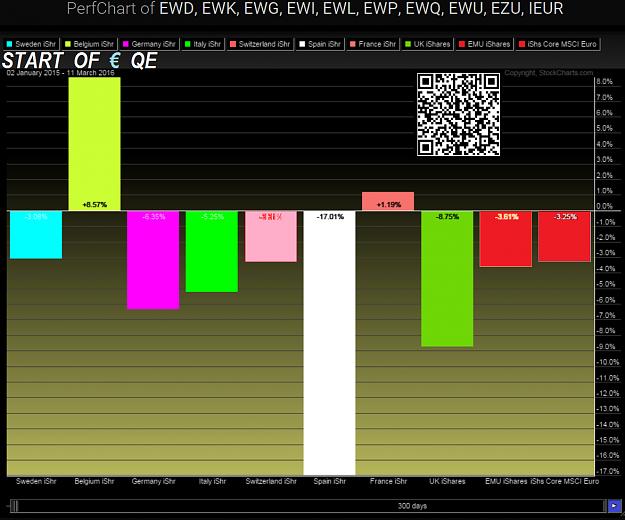
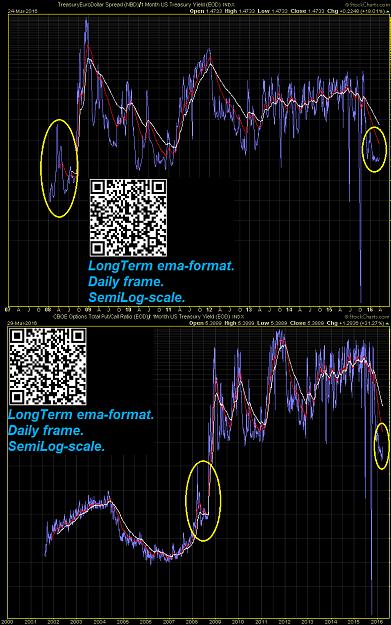
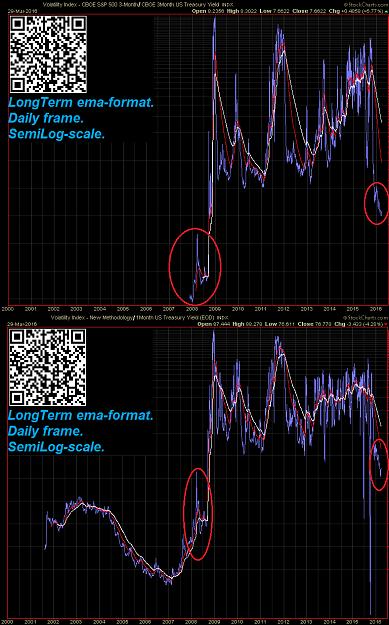
In this post there are 3 breadth indicators of NYSE stock market, in order to compare the current levels vs. previous key bottoms:
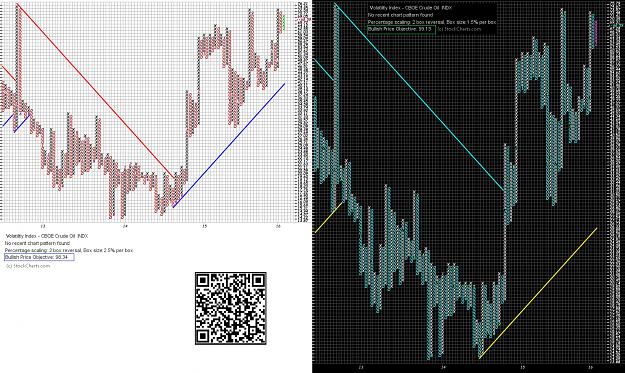
Absolute Breadth Indicator [see previous #post];
Stock% above its 200 daily moving average [see previous #post];
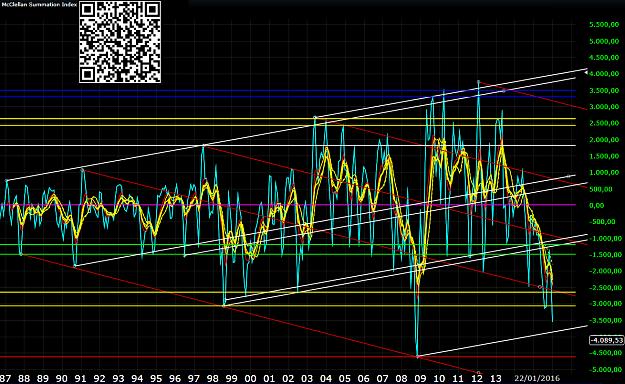
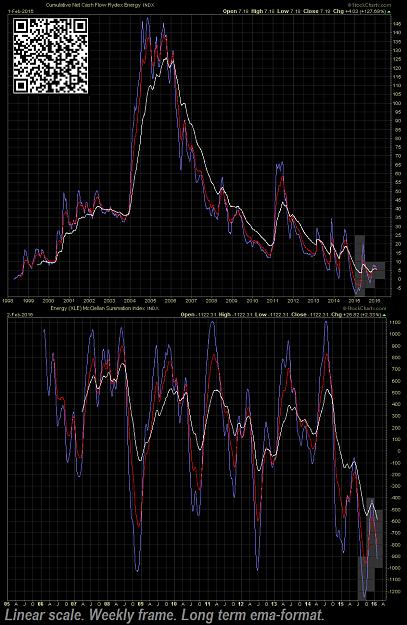
McClellan Summation Indicator [#1].
General stocks-benchmarks usefull for this post.
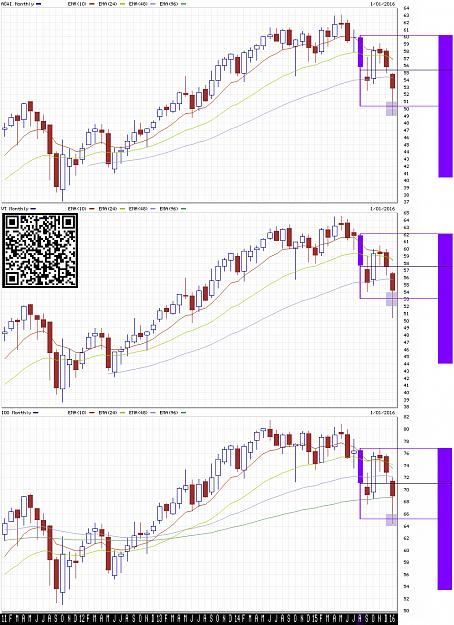
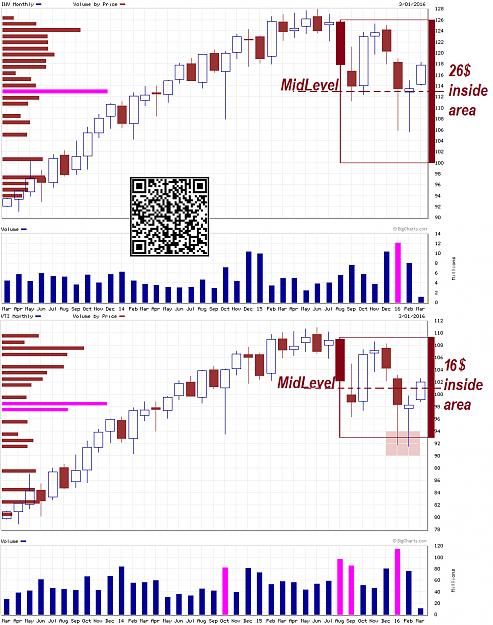
► main U.S. stocks-benchmarks (charts & notes: QQQ; ONEQ; DIA; OEF; SPY);
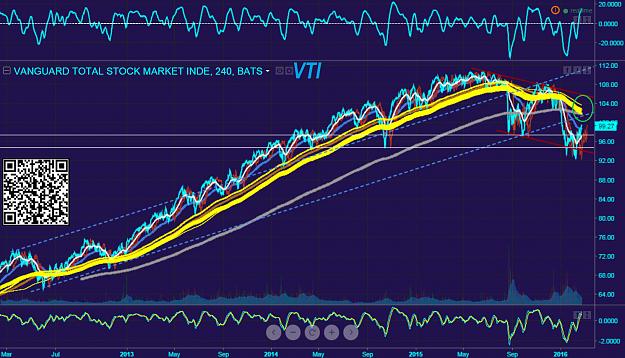
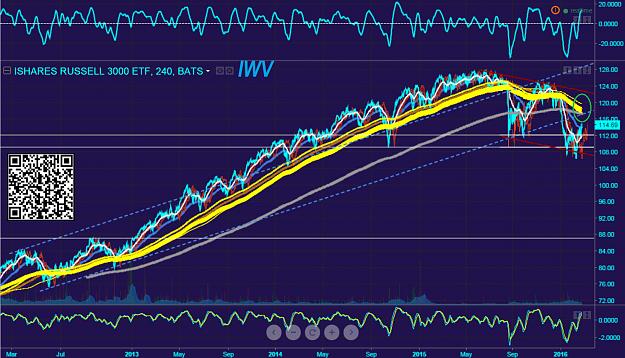
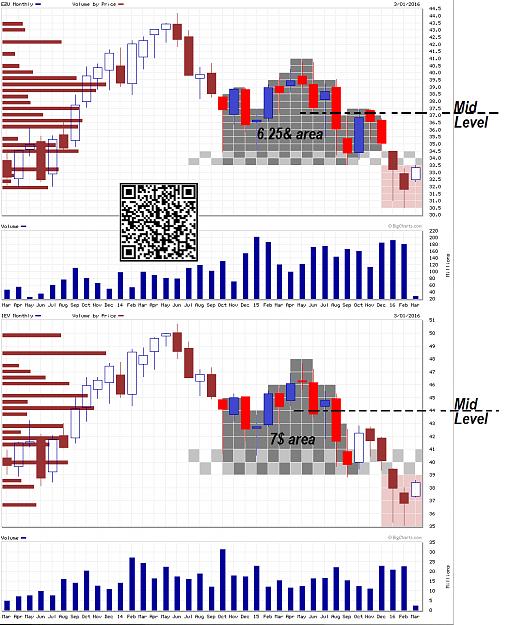
► global U.S. stocks-benchmarks (charts & notes: EUSA; ITOT; IWB; IWV; IYY; THRK);
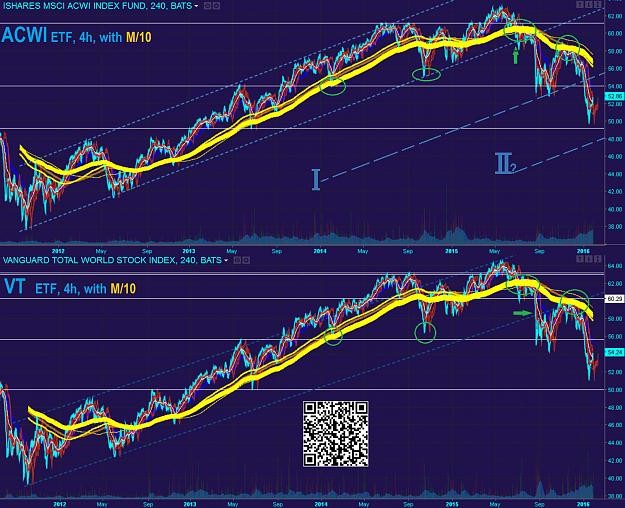
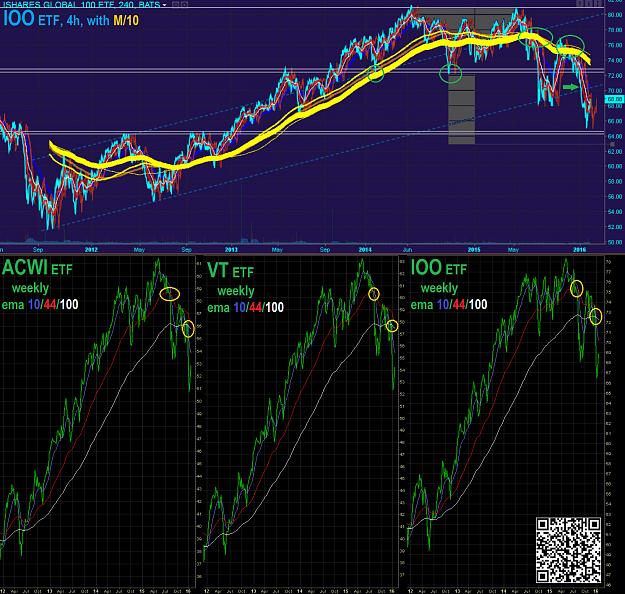
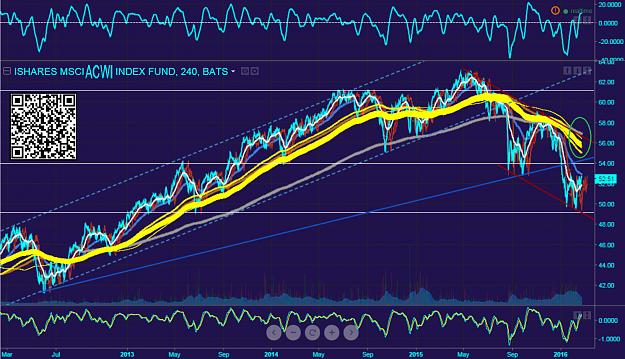
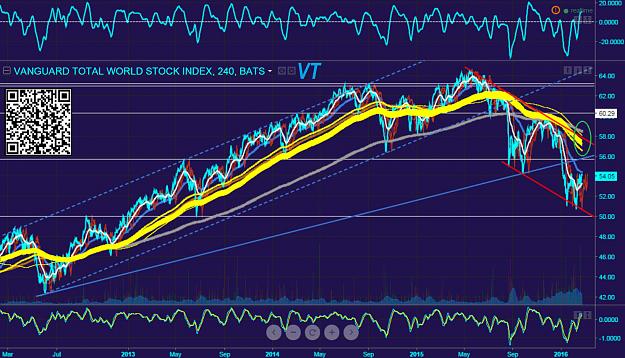
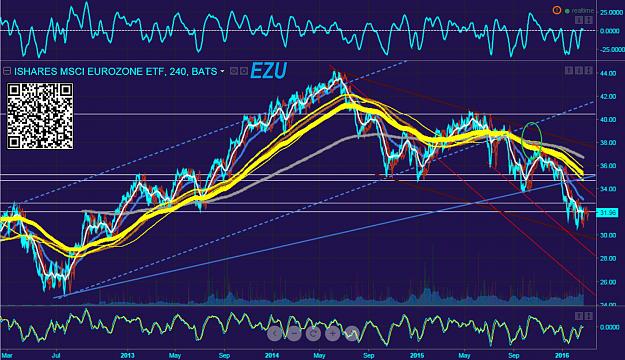
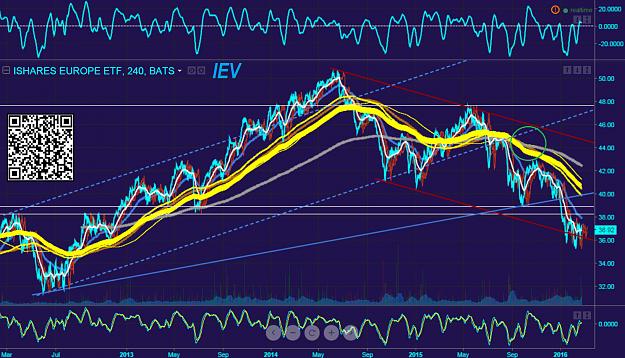
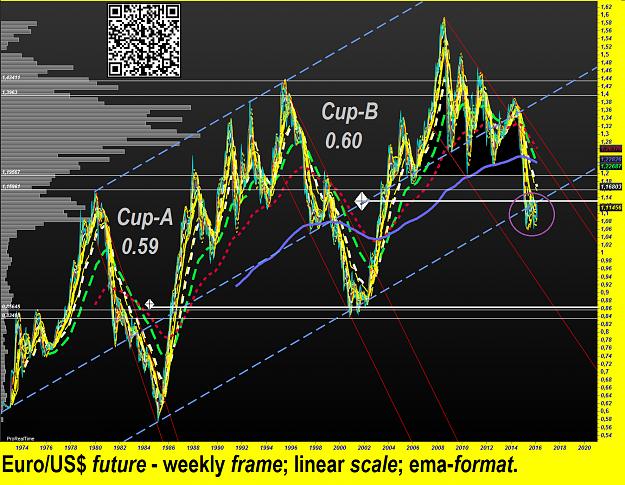
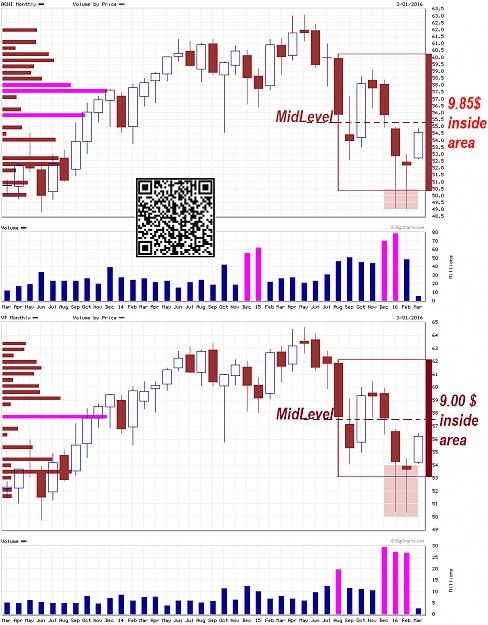
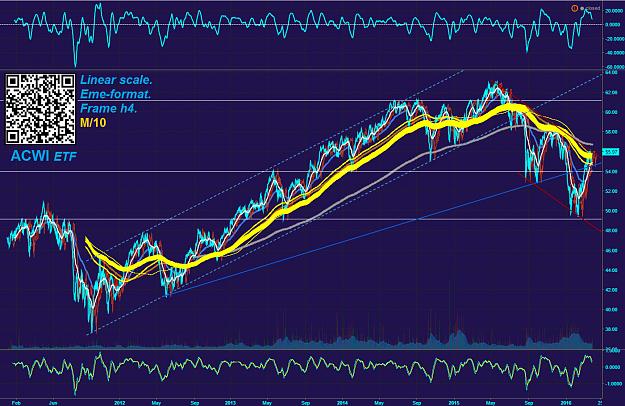
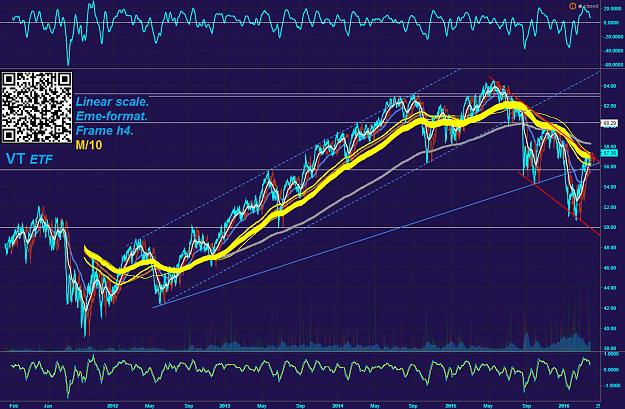
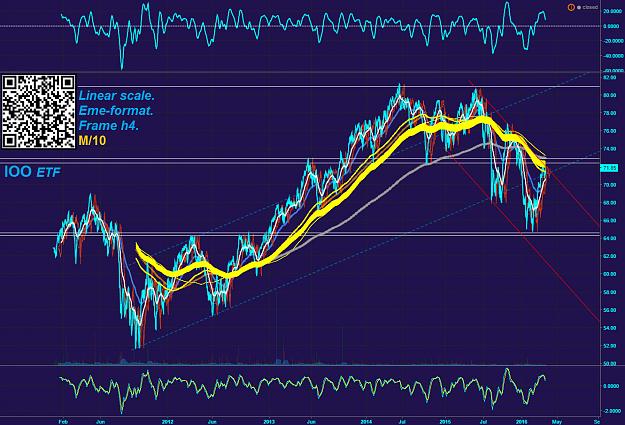
► global World stocks-benchmarks (charts & notes: ACWI; DGT; IOO; NYSE W.L.I.; ONEF; VT).
☒ Graphical Elements.
These breadth indicators shows current levels about in-line with the previous key-lows from 1986 until now, with the exclusion of 2008/2009.
There are the conditions for fast buying operations on underlyings.
There are also the conditions for an important impairment of main bull trend of underlyings.
☒ References.
☒ Chart sources.
❖ FreeStockCharts.
☒ Sorry for my bad English. I hope that this post is at least minimally useful [Contact].
Tuned on main trend, but follows short-medium term signs from underlying prices, for a correct & real-time set-up.
It is very important do not anticipate the main trend of the underlying financial instruments.
☻/♪ ❖ EARTH.pk, Alert 2.O !!! ❖
/▌
/|
I.M.O. by Sa!Vi ►►♥█║▌│││█║℠║▌║▌▌║█❤◀◀
#Ke'SaddhaPha'Pe'Kampa': #BundaBunda EMPIRE ❣!!!❣
Attached Image(s) (click to enlarge)