{quote} there is very good potential in this pair. once the market breaks out of the MN consolidation range, and Weekly has an Inside Bar break out, we are in good business in the days ahead. as for today and this week 4H swing, we target the average weekly range of between 220 and 290 pips. we must keep our ears on the ground - if and when BoJ will act on the strong JPY. Ask your friends in Tokyo to lookout and when they see Abe, Aso and Kuroda goes for sushi lunch together this week. http://www.marketwatch.com/story/ban...tes-2016-02-28...
Ignored
Hi,
I'm a bit confused about this pair and this post.
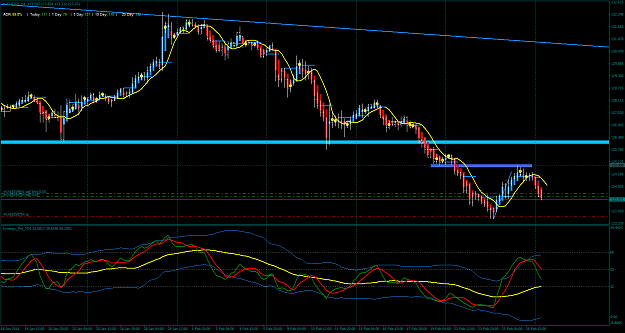
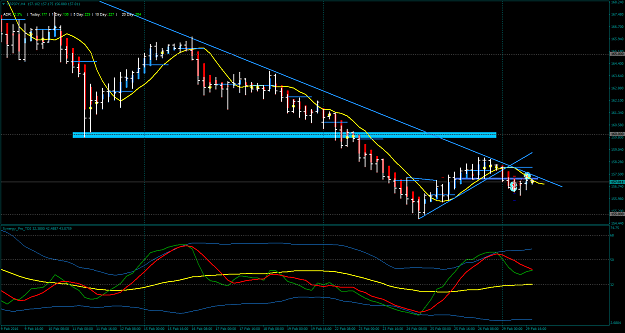
On the W1 chart I see a Double Inside Bar. This can be a reversal pattern but also a continuation. The consolidation is seen clearly on D1 and 4H that show the Triangle forming. This was (and is) ideal for 4H swing trading.
How I see it: There is potential room below for Run Sell. But if BoJ acts, they will pull another rabbit our their hat to weaken the Yen, not to strengthen it?
Ofcourse, the market will tell us where it will go, but I would like to know what else you are seeing in this pair to form your expectations
Hi Folks, We are in the last trading day for Feb 2016 and today happens only once every 4 years. Just to remind everyone, TMS 5-METHOD is a trend following trading method and it will work best when there is market volatility. How you determine the market trend and the market volatility is important. The next important thing you need to work on and decide is your money management strategy which must include how you do your risk management. Do you trade with the same risk all the time? When do you reduce your risk% per trade? When do you increase...
Ignored
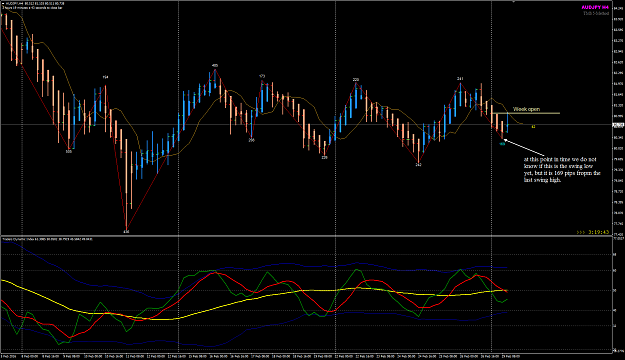
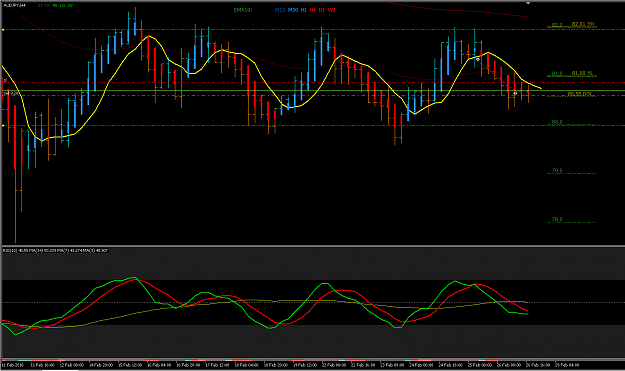
I see AUDJPY with potential to go into the free space below.
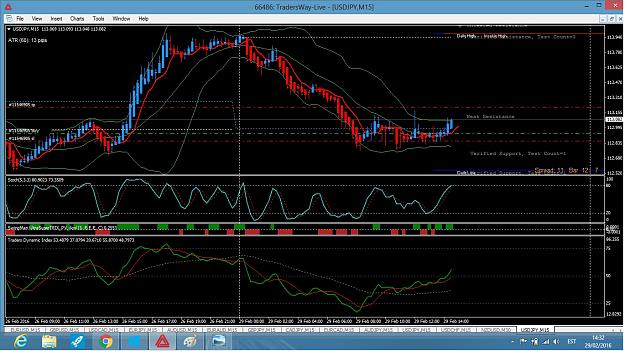
USDJPY has potential but there is this Double Bottom. How do you look at this one?
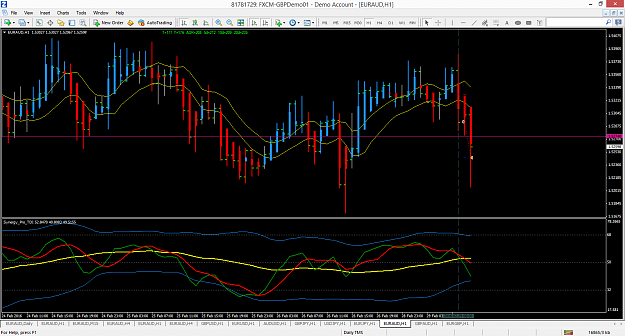
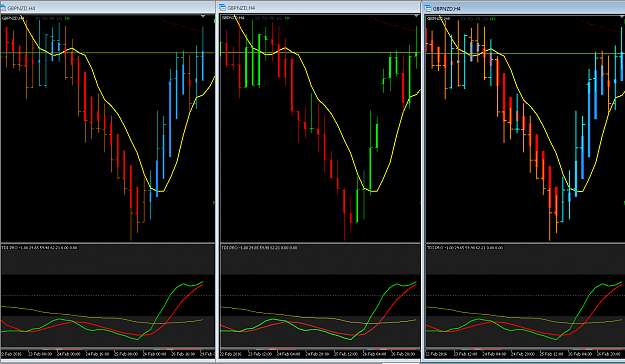
I see GBPAUD, GBPCAD, GBPJPY, GBPNZD, GBPUSD have been in this Sell phase last month.
{quote} there is very good potential in this pair. once the market breaks out of the MN consolidation range, and Weekly has an Inside Bar break out, we are in good business in the days ahead. as for today and this week 4H swing, we target the average weekly range of between 220 and 290 pips. we must keep our ears on the ground - if and when BoJ will act on the strong JPY. Ask your friends in Tokyo to lookout and when they see Abe, Aso and Kuroda goes for sushi lunch together this week. http://www.marketwatch.com/story/ban...tes-2016-02-28...
Ignored
Emmanuel:
"We target the weekly range." I get that we are supposed to look on the weekly chart with a 52 period ATR for this right? Do we target the whole range? A percentage? what about S&P from monthly chart in the way? Is that an instance of watch, see, react to PA at such times? Thanks
{quote} Emmanuel: "We target the weekly range." I get that we are supposed to look on the weekly chart with a 52 period ATR for this right? Do we target the whole range? A percentage? what about S&P from monthly chart in the way? Is that an instance of watch, see, react to PA at such times? Thanks LazyLobster
Ignored
Hi LL,
Simply use the ATR(52) on Weekly chart for the average weekly range for 52-weeks. It should be ~268pips.
Usually, we target 60% of this weekly range. But in some weeks when market is narrow range, we may not get that. But 40% is sure thing in the past 2 weeks on H4.
When market starts to trend and breaks out, then we look at 100% and even 120% of that range. This is provided we pick our 5-Method entries using APB#1 and #2.
Attached chart below shows the swing highs and swing lows of the past 2 weeks with the swing range in shown in pips. We cannot possibly pick tops and bottoms.
This week, we do not know if the week has made its high for this week yet. What we know now is the Week open and we target our 40% of the weekly range from this week's open. Should market move lower and reverses, we will take the buy setup and target based on the new swing low of this week.
Important that we see that AJ is sideways now and the narrow range.
Attached Image (click to enlarge)
regards,
Honesty is a very expensive gift. You wont find it in cheap people.WBuffett
{quote} Hi, I'm a bit confused about this pair and this post. On the W1 chart I see a Double Inside Bar. This can be a reversal pattern but also a continuation. The consolidation is seen clearly on D1 and 4H that show the Triangle forming. This was (and is) ideal for 4H swing trading. How I see it: There is potential room below for Run Sell. But if BoJ acts, they will pull another rabbit our their hat to weaken the Yen, not to strengthen it? Ofcourse, the market will tell us where it will go, but I would like to know what else you are seeing in...
Ignored
when BoJ acts, you can be sure the other central banks are ready for it...
Honesty is a very expensive gift. You wont find it in cheap people.WBuffett
{quote} I see AUDJPY with potential to go into the free space below. USDJPY has potential but there is this Double Bottom. How do you look at this one? I see GBPAUD, GBPCAD, GBPJPY, GBPNZD, GBPUSD have been in this Sell phase last month.
Ignored
it kind of late to see the GBP crosses were money makers the past weeks....
but now you know how to look for the SELL and BUY zones, you will be better prepared with your money.
Honesty is a very expensive gift. You wont find it in cheap people.WBuffett
{quote} it kind of late to see the GBP crosses were money makers the past weeks.... but now you know how to look for the SELL and BUY zones, you will be better prepared with your money.
Ignored
I had seen it but also try not to chase. Lots of GBP crosses gapped lower last week and continued without a real opportunity to get in afterwards I think. Knowing something is happening and making money from it are two completely different things in forex sometimes
How would you have traded these pairs last week for example if we missed the initial move? Trading continuation on 1H away from the DOL?
{quote} I had seen it but also try not to chase. Lots of GBP crosses gapped lower last week and continued without a real opportunity to get in afterwards I think. Knowing something is happening and making money from it are two completely different things in forex sometimes How would you have traded these pairs last week for example if we missed the initial move? Trading continuation on 1H away from the DOL?
Ignored
last week was something extraordinary with Cameron working very hard over the weekend.
were those big move anticipated? nobody knows how the market will react to world events.
but we are technical traders, we do our top down analysis and follow the higher timeframes.
when the market prove us wrong, we get out quick and that is why we have our stop loss.
to catch falling knifes, catch them from the top....
Honesty is a very expensive gift. You wont find it in cheap people.WBuffett
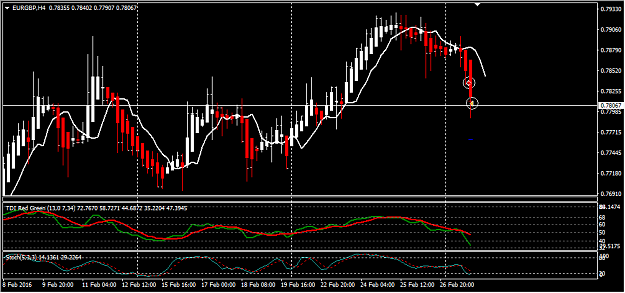
EA short for +50 pips, APB changed color to red, TDI cross {image}
Ignored
Hi TheScorpS,
Around the 2nd hour after LO, there is a PCRF and one would have bought the break of its high on the third London candle. Is there any reason that you didn't take that buy setup?
{quote} Hi LL, Simply use the ATR(52) on Weekly chart for the average weekly range for 52-weeks. It should be ~268pips. Usually, we target 60% of this weekly range. But in some weeks when market is narrow range, we may not get that. But 40% is sure thing in the past 2 weeks on H4. When market starts to trend and breaks out, then we look at 100% and even 120% of that range. This is provided we pick our 5-Method entries using APB#1 and #2. Attached chart below shows the swing highs and swing lows of the past 2 weeks with the swing range in shown in...
Ignored
Hi Emmanuel,
thank you for your explanation. My TP was set to 50% of that range from swing high, so I got 69 pips. I re-entered, but I am not sure if it had been a good decision..... we will see. I expected the market to range like before.... but I mustn't expect anything from the market, just "Follow the rhythm and pace with patience". Some day I will have learned it
{quote} Hi Dan. all price action analysis is done using the real price bars or Japanese candles. the APB/HA only to look at the bodu size and colour change. regards,
Ignored
If somebody is using MT5: Here is my modified HA indicator, where you can easily switch between Japanese candles, HA and an overlay of both just by using the "Arrow Up" or "Arrow Down" keys. I find it very convenient.
{quote} If somebody is using MT5: Here is my modified HA indicator, where you can easily switch between Japanese candles, HA and an overlay of both just by using the "Arrow Up" or "Arrow Down" keys. I find it very convenient. {image}{file}
Ignored
That is an excellent idea! I wish the same could be found for MT4...
[quote=emmanuel7788;8782593]{quote} Hi, when you use the TDI Red Green version and do your manual back-testing this way by using the F12 (Step-by_Step) what you are seeing is the TDI being refreshed in your history chart and the TDI Green line have been re-painted. This means you do not see the actual TDI Green line angle in realtime. There is an 'error' in the TDI Red Green coding, but we do not know if that was intended to be that way. But if you look at the later newer versions released by the original creator of the TDI, .....
Thanks emmanuel7788, so if I use the TDI_RT version for back testing it will show the same as the red green version would have done when live.
I don't plan on using big E's exit methods so missing a few bounce signals should be fine, I just like to see the tdi change only when the candle closes.
Thanks again.
Hi to all! A have a question about H4.
Do you recommend open orders only in London session or we can do it in asian session?
Todays night i skipped opportunity open in asian session and opened during early London and have loss