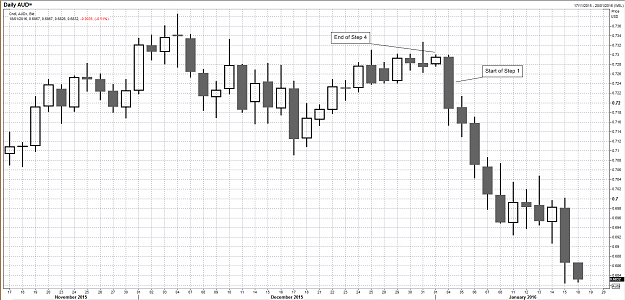
DislikedI think it relates to your diagram only in MP terms, the end of a distribution would be around the zone of the 1st Standard Deviation (I imagine that's somewhere within your Yellow Box)... where trading activity almost stops for a period before a new Step 1 starts the next distribution. This can be counter trend or with the trend.Ignored
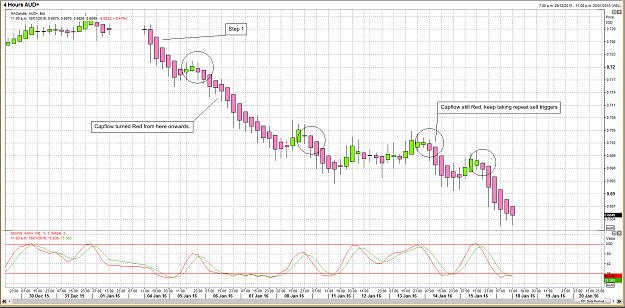
DislikedI think the key is identifying the start of Step 1 (the first 2 questions above), staying with the full move of Step 1Ignored
I also see this as you are seeing this as some kind of a cycle 1->2->3->4->1...etc