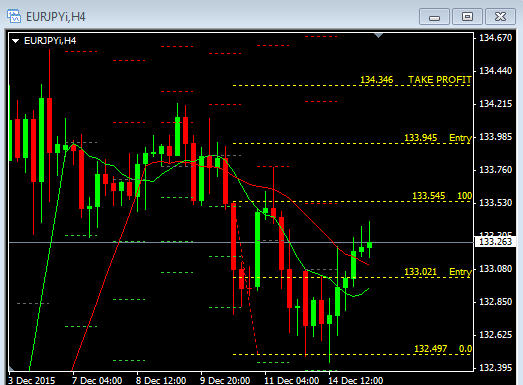
Setup on 1Hr. - buying the dip after one more zigzag down. SL @ 129.96 {image}
Ignored
Hello SkyHok. I have a question for you sir. The horizontal line which connects (2) and (4) I assume the peak prior to that one was where the horizontal was correct?
{quote} Hello SkyHok. I have a question for you sir. The horizontal line which connects (2) and (4) I assume the peak prior to that one was where the horizontal was correct? {image}
Ignored
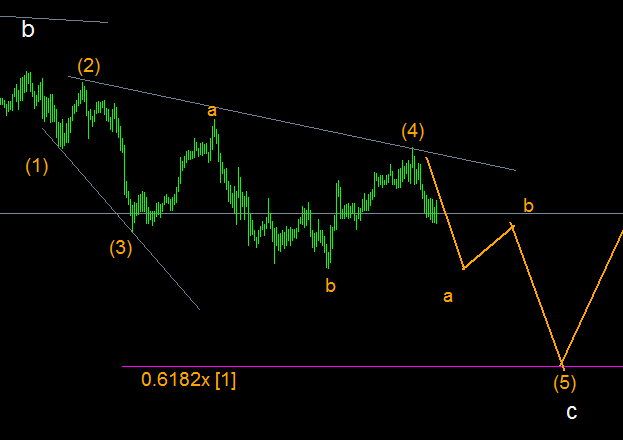
No sure about your question. It's an expanding diagonal wave c, with (2) and (4) overlap, and wave (4) is complex consist of 3 waves.
Attached Image
Elliott Wave for optimum entry, exit and risk management of trades
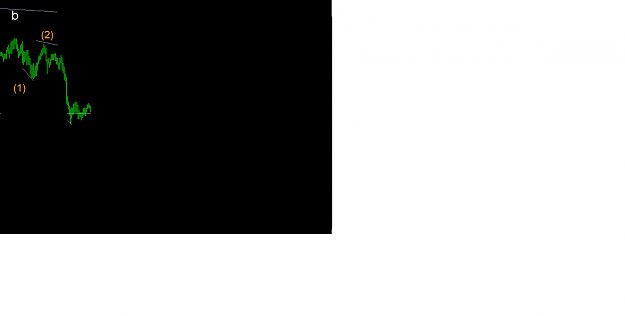
{quote} Ok say that your chart looks like the one below. {image} Where would you draw the trend line on the upside and down side?
Ignored
Thank you, that's a good question.
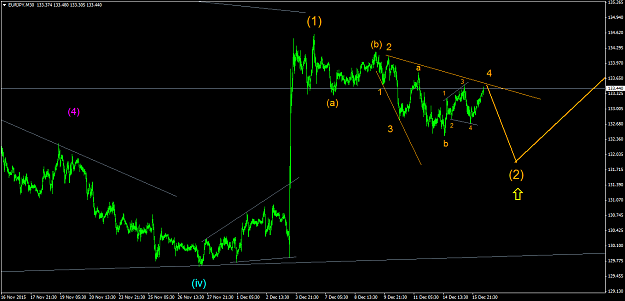
If it was at that stage of the market, I would assume it was developing an impulse wave and draw upper and lower channel lines as such:
Attached Image (click to enlarge)
However, it developed into an expanding diagonal with respective channel lines, with no harm done.
Yes, it first developed wave a top and place channel line on that, but later moved to connect (4). http://www.forexfactory.com/attachme...1&d=1450196795
Since (2)-(4) channel line needs to be clean with no parts of (3), (4) and (5) sticking out.
Just a note: channel lines connecting (1)-(3) and (2)-(4) are different from the usual parallel trend lines, as they are seldom parallel.
Elliott Wave for optimum entry, exit and risk management of trades
{quote} Thank you, that's a good question. If it was at that stage of the market, I would assume it was developing an impulse wave and draw upper and lower channel lines as such: {image} However, it developed into an expanding diagonal with respective channel lines, with no harm done. Yes, it first developed wave a top and place channel line on that, but later moved to connect (4). http://www.forexfactory.com/attachme...1&d=1450196795 Since (2)-(4) channel line needs to be clean with no parts of (3) and (5)...
Ignored
Got you.. Thank you so much for being as kind enough to explain to me how to do it. I always thought that people would place the trend lines at highs and lows, then adjust them if they are broken, then apply fibs to guess where the next high and low would be. Yet, you at least, use a different method of drawing them as you anticipant patterns, then adjustment it as you go long.
{quote} Got you.. Thank you so much for being as kind enough to explain to me how to do it. I always thought that people would place the trend lines at highs and lows, then adjust them if they are broken, then apply fibs to guess where the next high and low would be. Yet, you at least, use a different method of drawing them as you anticipant patterns, then adjustment it as you go long.
Ignored
By the way, here's the 2nd adjustment of 2-4 channel line, with no harm done:
Attached Image (click to enlarge)
Elliott Wave for optimum entry, exit and risk management of trades
Joined Oct 2007
|
Status: I'm on a 10 year plan.
|4,309 Posts
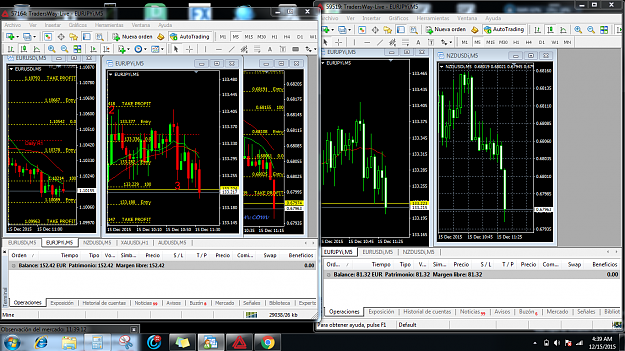
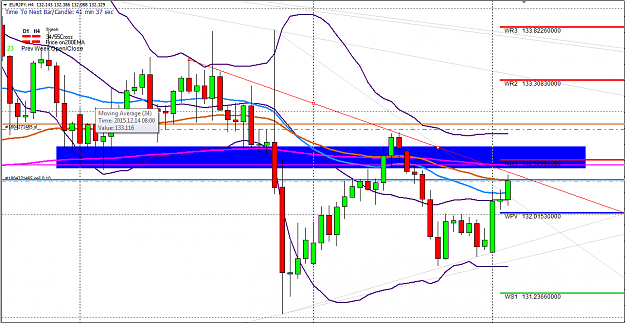
Good Morning..... I hope saved me some pips....
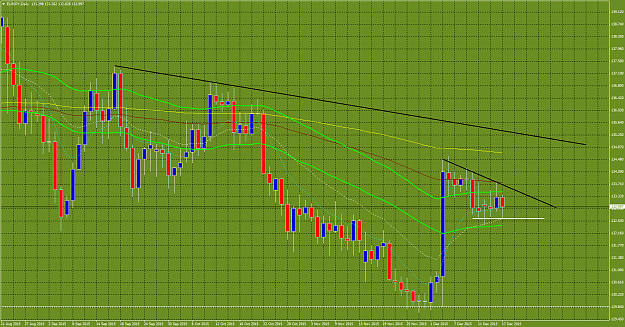
Check out this ej pennant....buy.. buy... buy is how this chart patter usually plays out., and I think that the next leg up is about as long as the flag pole if I remember correctly..... get in as low as you can......
Good Morning..... I hope saved me some pips.... Check out this ej pennant....buy.. buy... buy is how this chart patter usually plays out., and I think that the next leg up is about as long as the flag pole if I remember correctly..... get in as low as you can...... {image}
Ignored
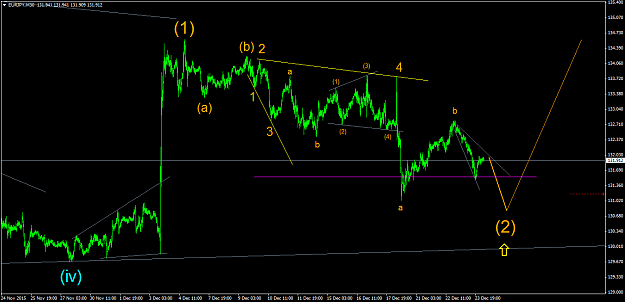
While I agree that being long this pair is good thing, I think we should go down a bit more as my analysis is more in line with skyhook. For now I'm short till we hit 132 or break up past the down trend line.
Believe your right, till proven wrong. Doubt is the greatest enemy.
{quote} While I agree that being long this pair is good thing, I think we should go down a bit more as my analysis is more in line with skyhook. For now I'm short till we hit 132 or break up past the down trend line.
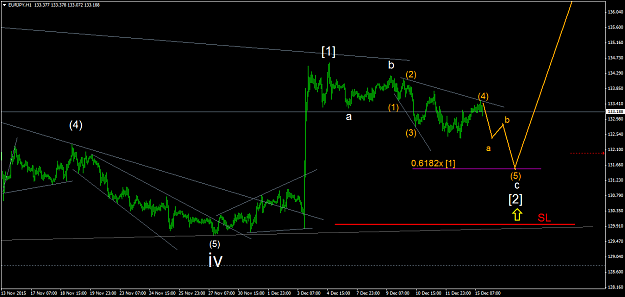
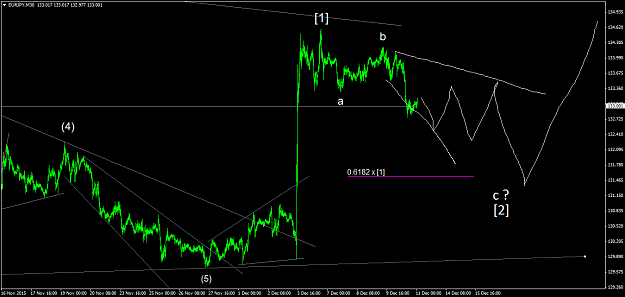
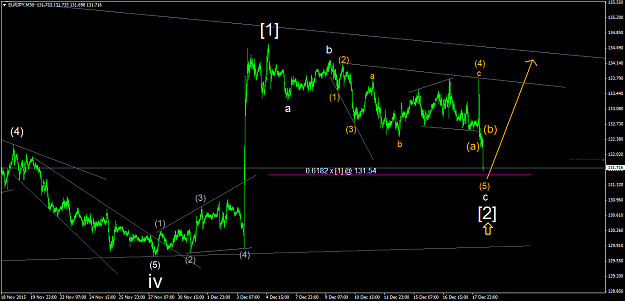
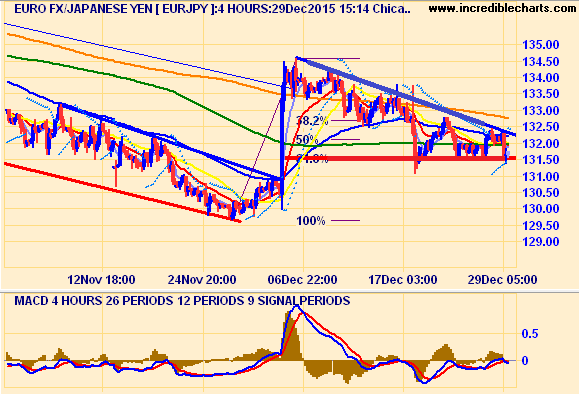
Just an update on present wave count set for reversal, as it's closing-in on 0.6182 retracement level.
The spike down looks strong, might place buy stop above present price at distance to one's liking.
Retracement since 4th December has been congestion that coiled up fuel for next week's rocket advance.
Attached Image (click to enlarge)
Elliott Wave for optimum entry, exit and risk management of trades
Good Morning..... I hope saved me some pips.... Check out this ej pennant....buy.. buy... buy is how this chart patter usually plays out., and I think that the next leg up is about as long as the flag pole if I remember correctly..... get in as low as you can...... {image}
Ignored
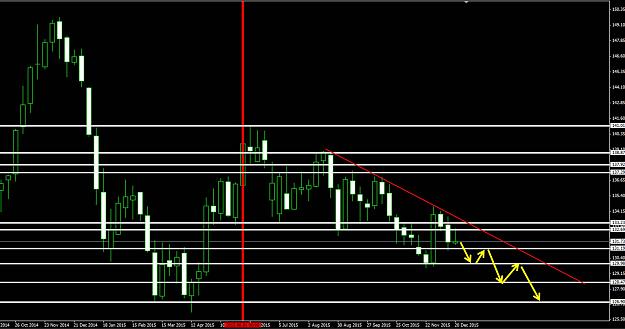
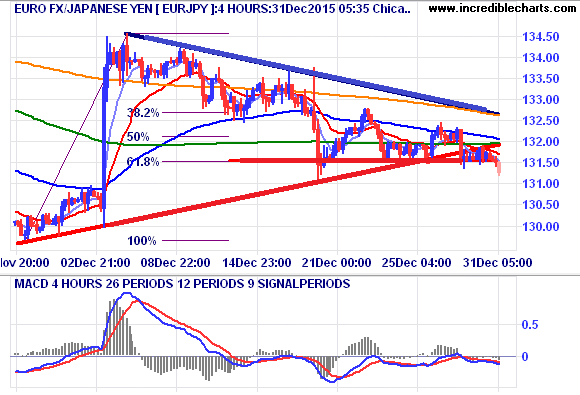
Looks like the pointy end of things here....Testing the 61.8% Fib and descending triangle (or Flag).